Answered step by step
Verified Expert Solution
Question
1 Approved Answer
The following data refer to the quantity sold of good Y (measured in kg), and the price of that good X (measured in pence

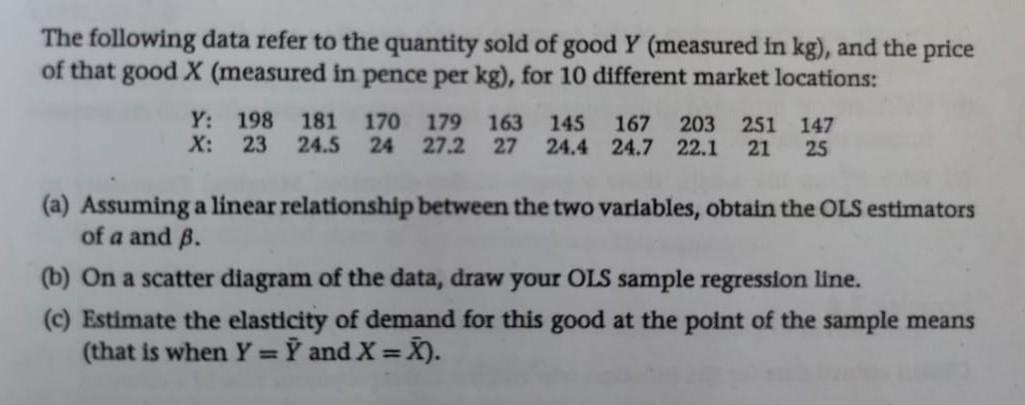
The following data refer to the quantity sold of good Y (measured in kg), and the price of that good X (measured in pence per kg), for 10 different market locations: Y: 198 181 170 179 163 145 167 203 251 147 X: 23 24.5 24 27.2 27 24.4 24.7 22.1 21 25 (a) Assuming a linear relationship between the two variables, obtain the OLS estimators of a and B. (b) On a scatter diagram of the data, draw your OLS sample regression line. (c) Estimate the elasticity of demand for this good at the point of the sample means (that is when Y = Y and X = X).
Step by Step Solution
There are 3 Steps involved in it
Step: 1

Get Instant Access to Expert-Tailored Solutions
See step-by-step solutions with expert insights and AI powered tools for academic success
Step: 2

Step: 3

Ace Your Homework with AI
Get the answers you need in no time with our AI-driven, step-by-step assistance
Get Started


