Answered step by step
Verified Expert Solution
Question
1 Approved Answer
The following data represent the cost of electricity during July 2018 for a random sample of 50 on-bedroom apartment in a small city. $96,171,202, 178,
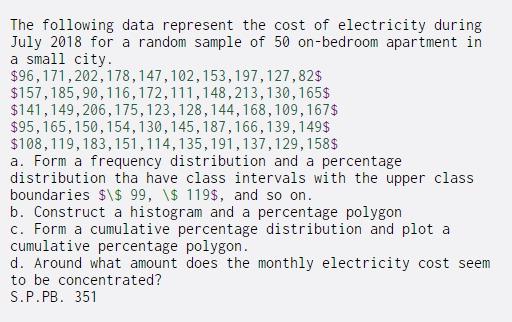
The following data represent the cost of electricity during July 2018 for a random sample of 50 on-bedroom apartment in a small city. $96,171,202, 178, 147, 102, 153,197,127,82$ $157,185,90,116,172,111,148,213,130,165$ $141, 149,206,175,123, 128, 144, 168,109,167$ $95,165, 150, 154,130,145,187,166,139, 149$ $108,119,183, 151, 114, 135, 191,137,129, 158$ a. Form a frequency distribution and a percentage distribution tha have class intervals with the upper class boundaries $\$ 99, \$ 119$, and so on. b. Construct a histogram and a percentage polygon c. Form a cumulative percentage distribution and plot a cumulative percentage polygon. d. Around what amount does the monthly electricity cost seem to be concentrated? S.P.PB. 351
Step by Step Solution
There are 3 Steps involved in it
Step: 1
Get Instant Access to Expert-Tailored Solutions
See step-by-step solutions with expert insights and AI powered tools for academic success
Step: 2
Step: 3
Ace Your Homework with AI
Get the answers you need in no time with our AI-driven, step-by-step assistance
Get Started