Answered step by step
Verified Expert Solution
Link Copied!

Question

1 Approved Answer

. The following data represent the total compensation for 10 randomlyr selected chief executive ofcers (CEDI and the company's stock performance in 2009. Compensation in
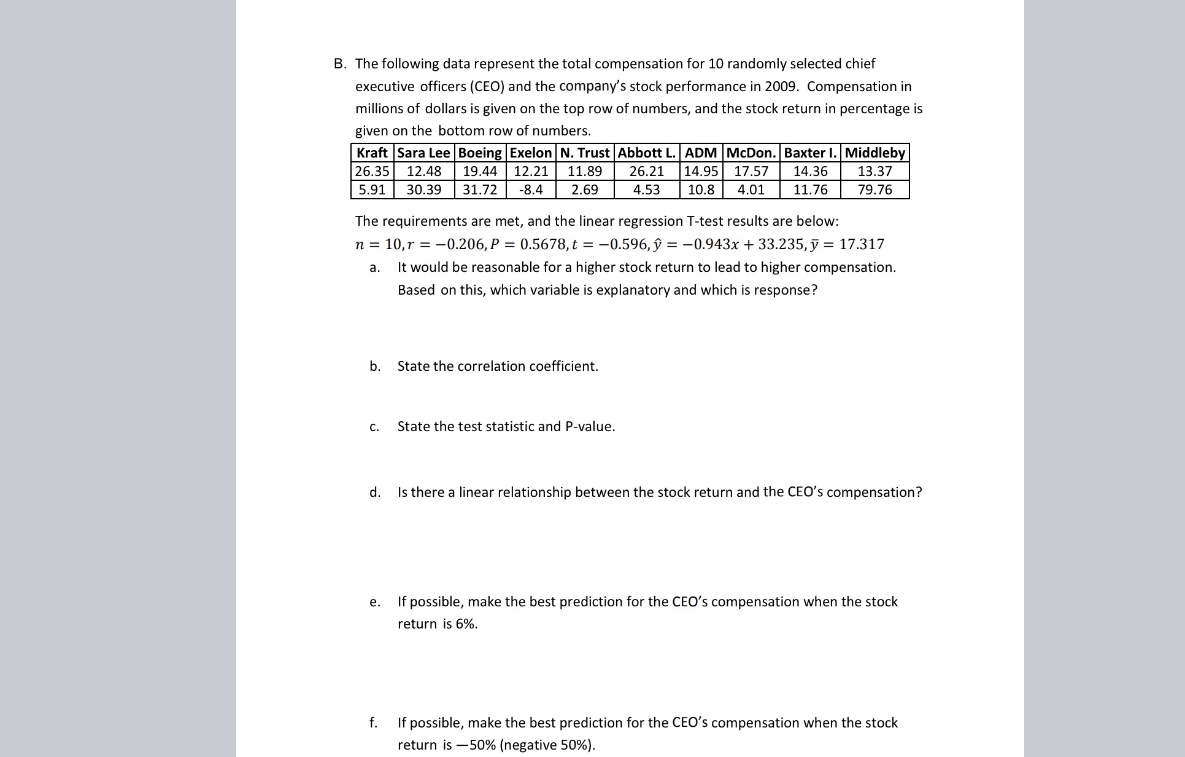
image text in transcribed
. The following data represent the total compensation for 10 randomlyr selected chief executive ofcers (CEDI and the company's stock performance in 2009. Compensation in millions of dollars is given on the top row of numbers, and the stock return in percentage is given on the bottom rowof numbers. EMILE! EXIEEEEI 3112 mmm- 113's ?9?6 The requirements are met, and the linear regression T-test results are below: 11. = 10,r = {l.206,P = D.5673,t = 41596,? = 41943:: + 33.2353 = 17.31? a. It would be reasonable for a higher stock return to lead to higher compensation. Based on this, which variable is explanatory and which is response? b. State the correlation coefficient. c. State the test stalistic and P-value. d. Is there a linear relationship between the stock return and the CEO's compensation? e. If possible, make the best prediction for the CEO'S compensation when the stock return is 6%. f. If possible, make the best prediction for the CEO'S compensation when the stock return is 50% (negative 50%]

Step by Step Solution

There are 3 Steps involved in it

Step: 1

blur-text-image

Get Instant Access to Expert-Tailored Solutions

See step-by-step solutions with expert insights and AI powered tools for academic success

Step: 2

blur-text-image_2

Step: 3

blur-text-image_3

Ace Your Homework with AI

Get the answers you need in no time with our AI-driven, step-by-step assistance

Get Started

Recommended Textbook for

Advanced Engineering Mathematics

Authors: ERWIN KREYSZIG

9th Edition

0471488852, 978-0471488859

More Books

Students also viewed these Mathematics questions

Question

Describe recent trends in new business start-ups.

Answered: 1 week ago