Answered step by step
Verified Expert Solution
Link Copied!

Question

1 Approved Answer

The following data represents the fatality rate of drivers at certain ages. Age 40 45 50 55 80 85 90 FR 0.75 0.75 0.95 1.05
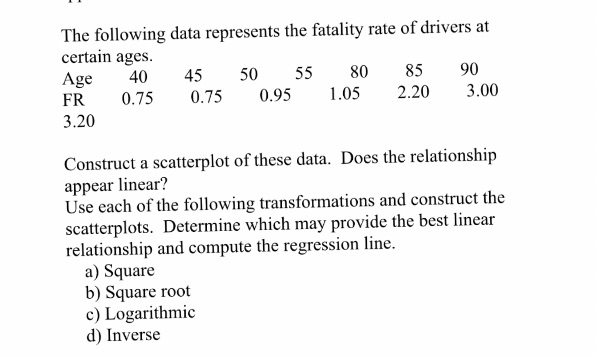
image text in transcribed
The following data represents the fatality rate of drivers at certain ages. Age 40 45 50 55 80 85 90 FR 0.75 0.75 0.95 1.05 2.20 3.00 3.20 Construct a scatterplot of these data. Does the relationship appear linear? Use each of the following transformations and construct the scatterplots. Determine which may provide the best linear relationship and compute the regression line. a) Square b) Square root c) Logarithmic d) Inverse

Step by Step Solution

There are 3 Steps involved in it

Step: 1

blur-text-image

Get Instant Access to Expert-Tailored Solutions

See step-by-step solutions with expert insights and AI powered tools for academic success

Step: 2

blur-text-image

Step: 3

blur-text-image

Ace Your Homework with AI

Get the answers you need in no time with our AI-driven, step-by-step assistance

Get Started

Recommended Textbook for

Birds Higher Engineering Mathematics

Authors: John Bird

9th Edition

1000353036, 9781000353037

More Books

Students also viewed these Mathematics questions

Question

9. Describe the characteristics of power.

Answered: 1 week ago