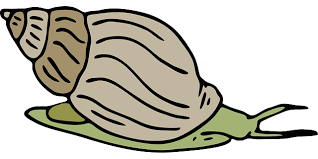
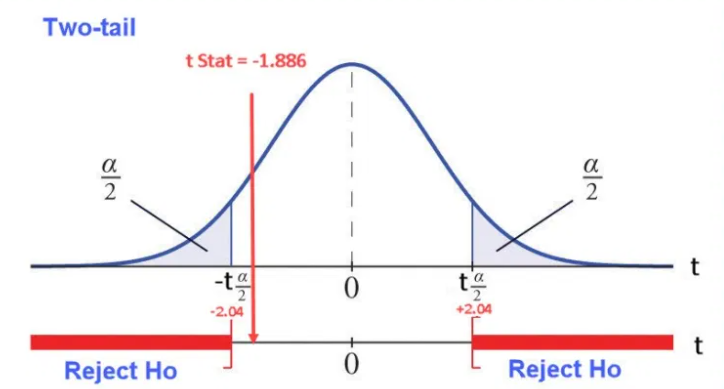
The following data sets are measurements made of the thickness (mm) of shells of the snail Littorina obtusata. Sample of 12 Snails were collected from sites with crab predators and without crab predators.
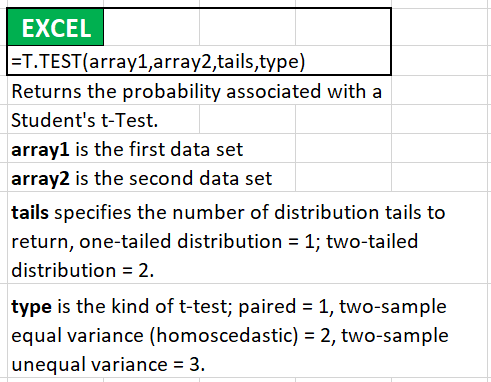
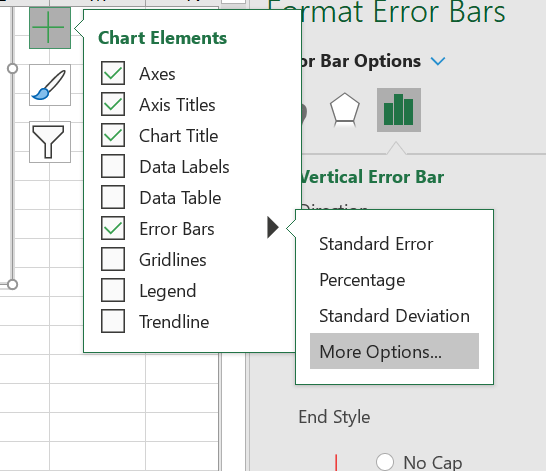
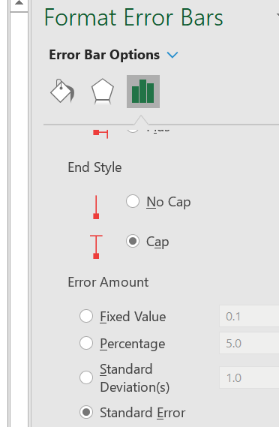
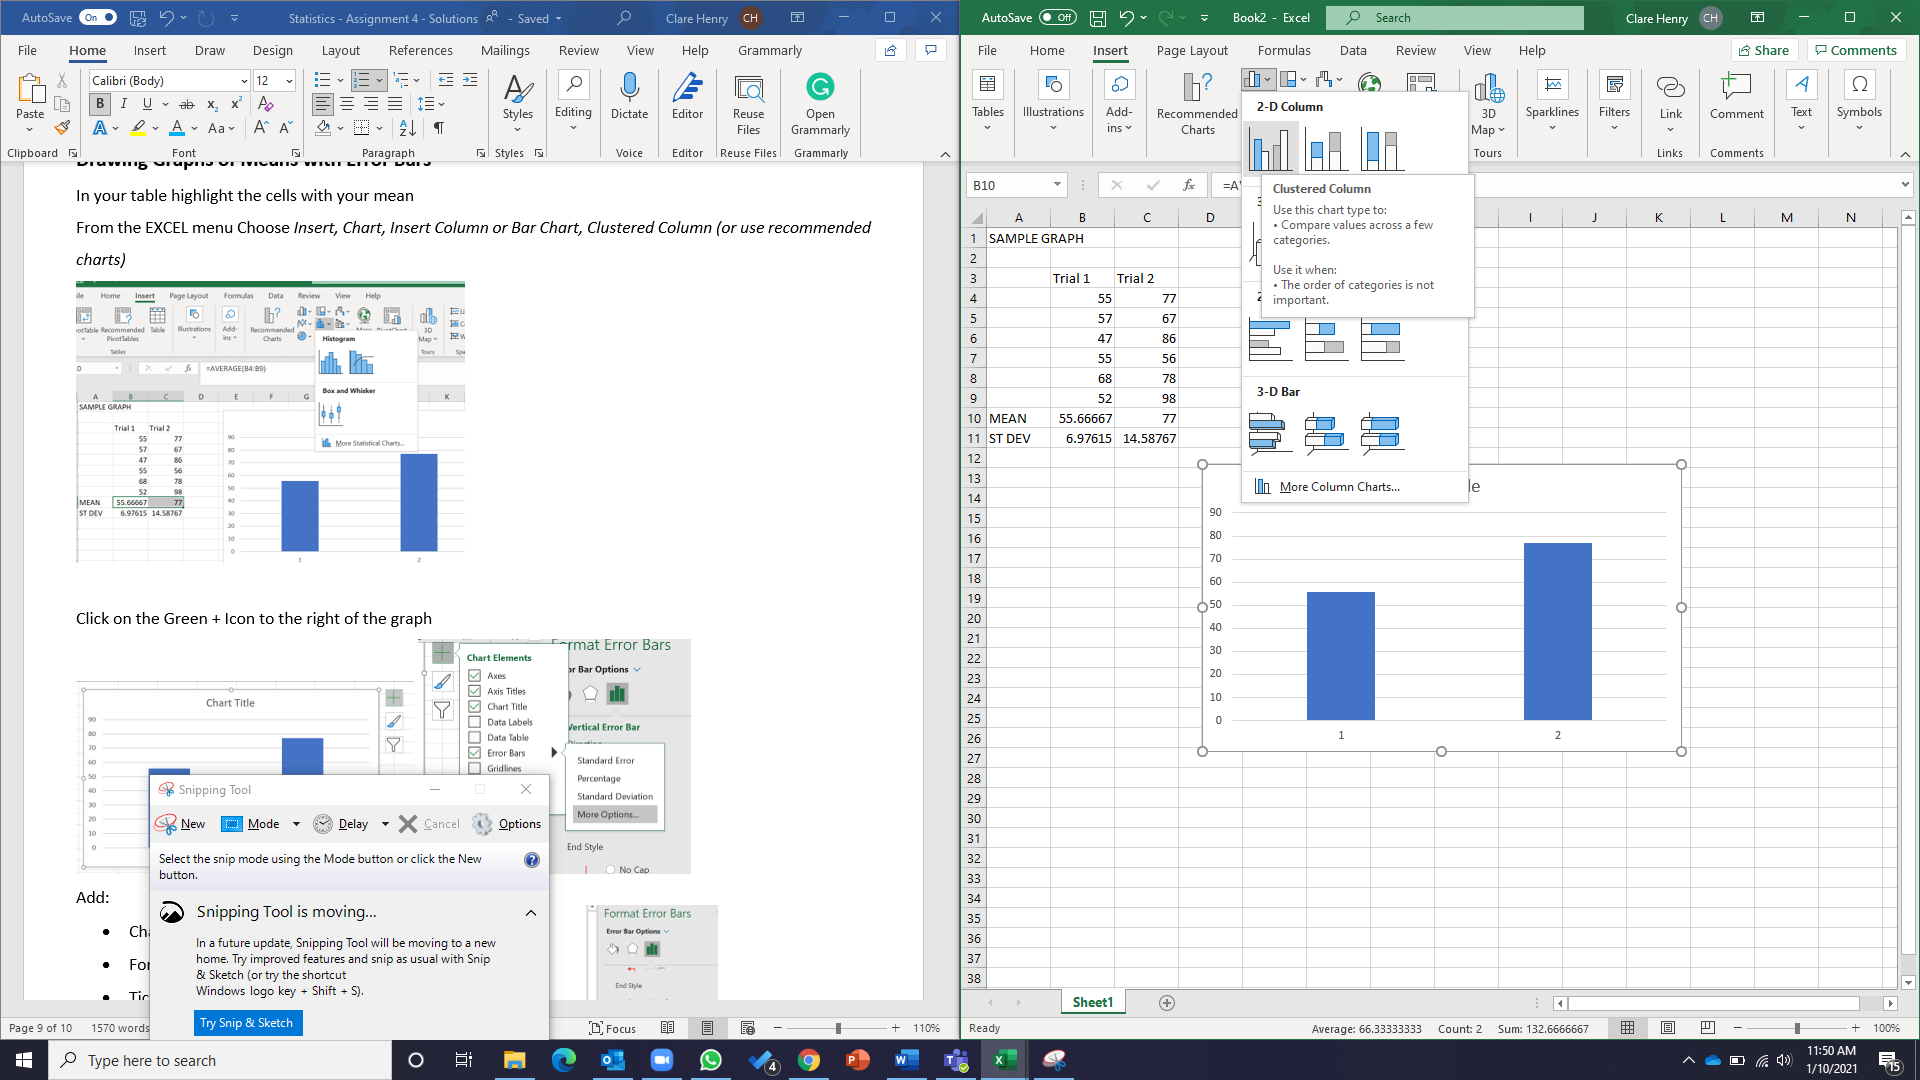
\f\f\fEXCEL =T.TEST(array1,array2, tails,type) Returns the probability associated with a Student's t-Test. array1 is the first data set array2 is the second data set tails specifies the number of distribution tails to return, one-tailed distribution = 1; two-tailed distribution = 2. type is the kind of t-test; paired = 1, two-sample equal variance (homoscedastic) = 2, two-sample unequal variance = 3.EXCEL =T.TEST(array1,array2, tails,type) Returns the probability associated with a Student's t-Test. array1 is the first data set array2 is the second data set tails specifies the number of distribution tails to return, one-tailed distribution = 1; two-tailed distribution = 2. type is the kind of t-test; paired = 1, two-sample equal variance (homoscedastic) = 2, two-sample unequal variance = 3.\f+ rmat Error Bars Chart Elements or Bar Options v Axes Axis Titles Chart Title Data Labels Vertical Error Bar Data Table Error Bars Standard Error Gridlines Legend Percentage Trendline Standard Deviation More Options.. End Style O No CapEXCEL =T.TEST(array1, array2, tails, type Returns the probability associated with a Student's t-Test.Format Error Bars Error Bar Options End Style No Cap T O Cap Error Amount O Fixed Value 0.1 Percentage 5.0 O Standard 1.0 Deviation(s) O Standard Error\fGROW TRAY TIMER RESERVOIR WATER / NUTRIENTS NUTRIENT PUMP AIR STONE AIR PUMP\fAutoSave On : () - Statistics - Assignment 4 - Solutions " - Saved O Clare Henry CH 0 X AutoSave . Of H Book2 - Excel Search Clare Henry CH File Home Insert Design Layout References Mailings Review View Help Grammarly File Home nsert Page Layout Formulas Data Review View Help Share Comments Calibri (Body) -12 O Lol H? Paste BIU ab X x A Styles Editing Dictate Editor Reuse Open Tables Illustrations Add- Recommended 2-D Column 30 Sparklines Filters Link Comment Text Symbols A L Av Aa A A Files Grammarly ins v Charts Map Clipboard Font Paragraph si Styles Voice Editor | Reuse Files | Grammarly Tours Links Comments rupno B10 X V =A In your table highlight the cells with your mean Clustered Column B C D Use this chart type to: N From the EXCEL menu Choose Insert, Chart, Insert Column or Bar Chart, Clustered Column (or use recommended Compare values across a few K L M 1 SAMPLE GRAPH categories. charts) Trial 1 Use it when: Trial 2 . The order of categories is not Home Insert Page Layout Formulas Data Review View Help 55 77 2 i important h? CO VOI UI A W N - 57 67 ofTable ammendes Must ations Add . Charts Histogram 47 86 55 56 X V f =AVERAGE(B4:89) 68 78 Box and Whisker 9 52 98 3-D Bar AMPLE GRAPH 10 MEAN 55.66667 77 Trial 1 Trial 2 55 if More Statistical Charts.. 11 ST DEV 6.97615 14.58767 In More Column Charts... le MEAN 55.66667 ST DEV 6.97615 14.58767 90 70 50 Click on the Green + Icon to the right of the graph O Format Error Bars Chart Elements A or Bar Options Axis Title Chart Title Y Chart Title Data Labels Vertical Error Bar Data Table 1 2 Error Bars Standard Error Gridlines Percentage Snipping Tool X Standard Deviation New Mode Delay . X Cancel Options More Options_ End Style Select the snip mode using the Mode button or click the New button. No Cap Add: Snipping Tool is moving... Format Error Bars Ch Error Bar Options In a future update, Snipping Tool will be moving to a new For home. Try improved features and snip as usual with Snip & Sketch (or try the shortcut ind Style Tir Windows logo key + Shift + S). Sheet1 + Page 9 of 10 1570 words Try Snip & Sketch Focus 08 8 - - - + Ready Average: 66.33333333 Count: 2 Sum: 132.6666667 100% Type here to search O P W T X 11:50 AM 1/10/2021 15
