Answered step by step
Verified Expert Solution
Link Copied!

Question

1 Approved Answer

The following data show the 10-year historical returns of S&P 500 and 3-month T-bill. Fund A invested $100 to S&P 500 at the beginning of
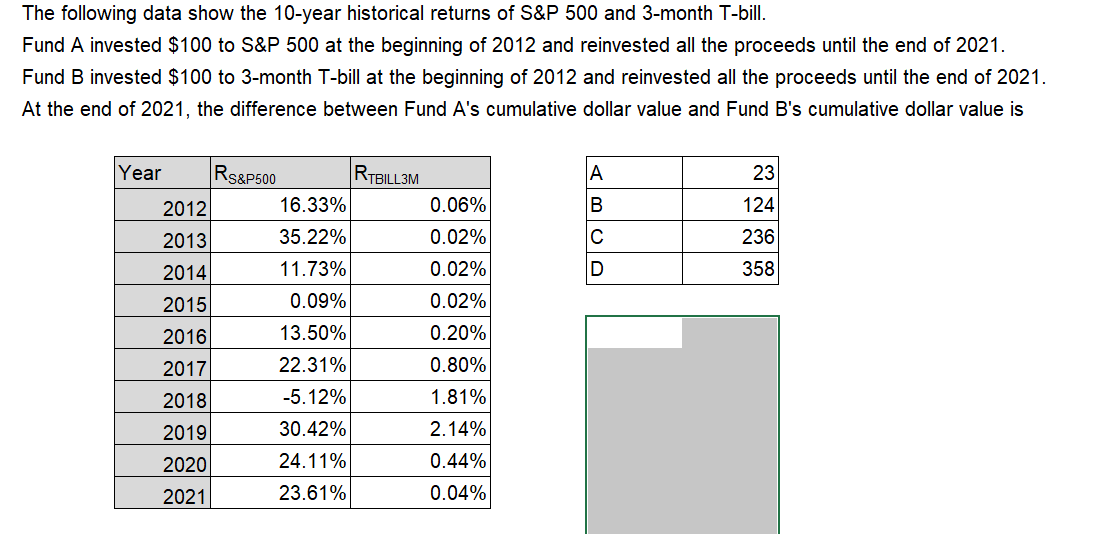
image text in transcribed

The following data show the 10-year historical returns of S&P 500 and 3-month T-bill. Fund A invested $100 to S&P 500 at the beginning of 2012 and reinvested all the proceeds until the end of 2021. Fund B invested $100 to 3-month T-bill at the beginning of 2012 and reinvested all the proceeds until the end of 2021. At the end of 2021, the difference between Fund A's cumulative dollar value and Fund B's cumulative dollar value is A 23 B 124 236 358 Year RS&P500 RTBILL3M 2012 16.33% 0.06% 2013 35.22% 0.02% 2014 11.73% 0.02% 2015 0.09% 0.02% 2016 13.50% 0.20% 2017 22.31% 0.80% 2018 -5.12% 1.81% 2019 30.42% 2.14% 2020 24.11% 0.44% 2021 23.61% 0.04%

Step by Step Solution

There are 3 Steps involved in it

Step: 1

blur-text-image

Get Instant Access to Expert-Tailored Solutions

See step-by-step solutions with expert insights and AI powered tools for academic success

Step: 2

blur-text-image

Step: 3

blur-text-image

Ace Your Homework with AI

Get the answers you need in no time with our AI-driven, step-by-step assistance

Get Started

Recommended Textbook for

Multinational Business Finance

Authors: David K. Eiteman, Arthur I. Stonehill, Michael H. Moffett

16th Edition

013749601X, 978-0137496013

More Books

Students also viewed these Finance questions

Question

Describe how to structure a linear programming model

Answered: 1 week ago