The following data show the alcohol expenditure, income, number of adults in each of 17 households and whether or not the family contains at least one person who smokes.
Family Alcohol expenditure (X) Income (Y) Adult Smoker 1 26.17 487 2 0 2 19.49 574 2 0 3 17.87 439 1 1 4 16.90 367 2 0 5 4.21 299 1 0 6 32.08 743 2 1 7 30.19 433 2 0 8 22.62 547 2 0 9 9.86 303 1 0 10 13.32 370 2 1 11 9.24 299 1 1 12 47.35 531 4 1 13 26.80 506 2 1 14 33.44 613 2 0 15 21.41 472 3 0 16 16.06 253 1 1 17 24.98 374 2 0
A.Draw an XY plot of the data and comment.
B.From the chart, would you expect the line of best fit to slope up or down? In theory, which way should it slope?
C.Calculate the correlation coefficient between alcohol spending and income.
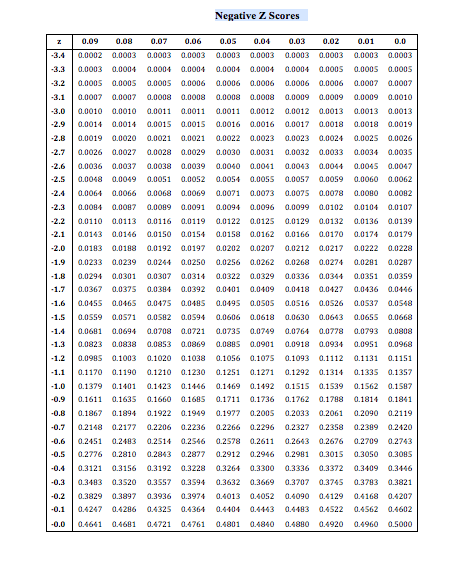
D.Is the coefficient significantly different from zero? What is the implication of the result?
E.Estimate a multiple regression model of expenditure on alcohol, using income, the number of adults and whether there is a smoker in the household as the three explanatory variables. Do the coefficients have the expected signs? Interpret your results.
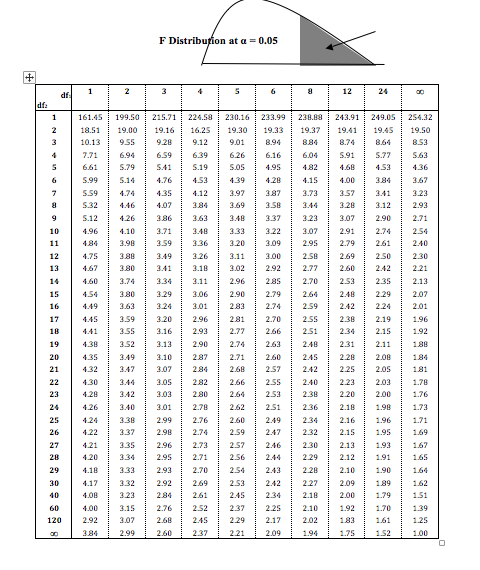
F.Test the significance of the individual coefficients and of the regression as a whole.
G.Should the model be simplified?
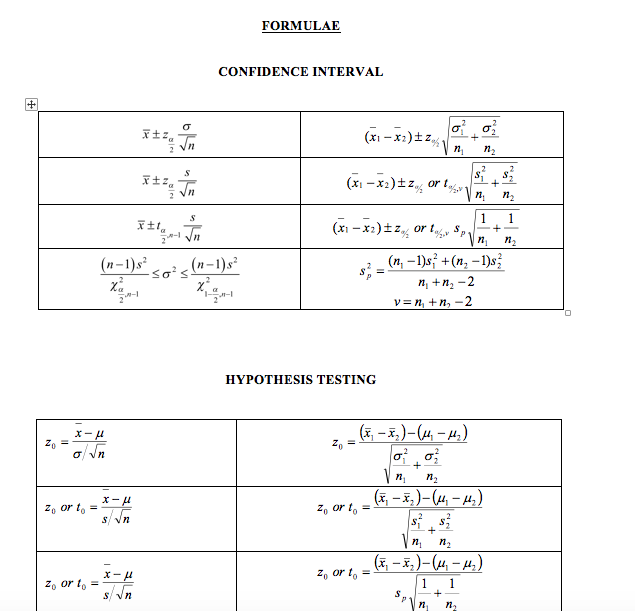
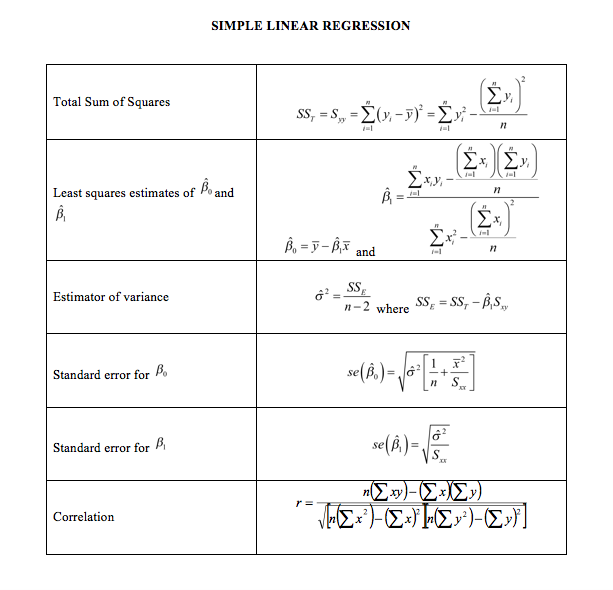
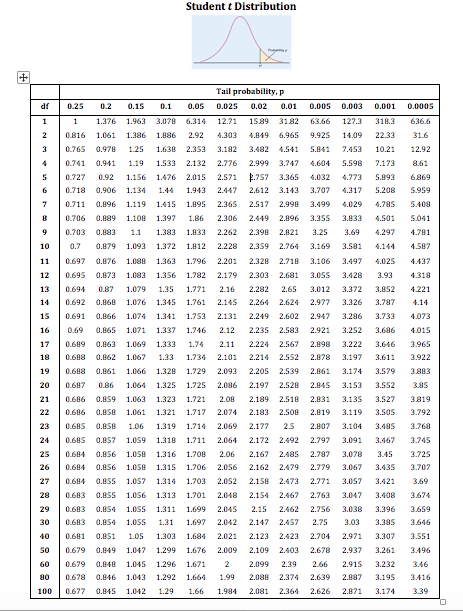
FORMULAE CONFIDENCE INTERVAL of Vin (x1 - x2)12 (x - x1)tz, or by 5p 1 1 (#-1)83 Sox( m-1)82 (n, -1)s +(n, -1)83 A thy -2 V= M th, -2 HYPOTHESIS TESTING x- HI (5 - 52 ) - ( 4 - 12) Zo or to = - X- z, or t = (X - X, ) - ( 4 - 12) Z, or to = (5 - 5 , ) - ( 4, - #2) X - H 1 1 s/ vnSIMPLE LINEAR REGRESSION Total Sum of Squares SS, = 5, = E(v - >) = Ex xy, Least squares estimates of Po and B, IM Bo = V - B,x and o'=- SS Estimator of variance 1-2 where SS = SS, - B,S., Standard error for Po se ( B.) = 6' 1 x Standard error for se ( B , ) = " ( E xy ) - (E x X Ey) CorrelationStudent t Distribution Tail probability, p 0.25 0.2 0.15 0.1 0.05 0.025 0.02 0.01 0.005 0.003 0.001 0.0005 1 1.476 1.964 3.078 6.314 12.71 1589 31 82 127.3 318.3 0816 1.061 1.386 1.086 2.92 4.303 4.849 6.965 9.925 14.09 22.31 0.765 0.978 1.25 1.630 2.353 3.182 3.482 4.541 5.841 7.453 10.21 12.92 0.741 0.941 1.19 1.533 2.132 2.776 2.999 3.747 4.604 5.598 7.173 8.61 0.727 0.92 1.156 1.476 2.015 2.571 1.757 3.365 4.032 4.773 5.092 6.869 0718 0.906 1.134 1.44 1.943 2.447 2.612 3.143 3.707 4.317 5.208 5.959 0711 0.896 1.119 1.415 1.895 2.365 2.517 2.998 3.499 4.029 4.785 5.400 0.706 0.189 1.108 1.397 1.86 2.306 2.449 2.096 3.355 3.132 4.501 5041 0703 0.883 1.1 ERE'L 1.833 2.262 2.390 2.021 3.25 3.69 4.297 1.701 0.7 0.879 1.093 1.372 1.#12 2.228 2.359 2.764 3.169 3.581 4.144 4.507 11 0.697 0.876 1.088 1.363 1.796 2.201 2.328 2.718 3.106 3.497 4.025 1.417 12 0.695 0.873 1.083 1.356 1.782 2.179 2.303 2.681 3.055 3.428 3.93 1318 13 0.694 1.079 1.35 1.771 2.16 2.282 2.65 3.012 3.372 3.852 4.221 14 0.692 1.076 1.345 1.761 2.145 2.264 2.624 2.977 3.326 3.787 4.14 15 0.691 0.066 1.074 1.341 1.753 2.131 2.249 2.602 2.947 3.286 3.733 4.073 10 0.69 0.865 1.071 1.337 1.746 2.12 2.235 2.583 2.921 3.252 3.686 4.015 17 0.689 0.863 1.069 1.333 1.74 2.11 2.224 2.567 2.898 3.222 3.646 3.965 18 0.608 0.862 1.067 1.13 1.734 2.101 2.214 2.552 2.878 3.197 3.611 3.922 19 1.066 1.328 1.729 2.093 2.205 2.539 2.041 3.174 3.579 20 1.BG 1.064 1.325 1.725 2.086 2.197 7 2.520 2.045 3.153 3.552 3.85 21 0.859 1.063 1.323 1.721 2.08 2.189 2.518 2.131 3.135 3.527 3819 22 0.858 1.061 1.321 1.717 2.074 2.183 2.508 2.819 3.119 3.505 3.792 23 0.685 0.858 1.06 1.319 1.714 2.069 2.177 2.5 2.107 3.104 3.485 3.768 24 0.685 0.857 1.059 1.310 1.711 2.064 2.172 2.492 2.797 3.091 3.467 3.745 25 0.684 0.856 1.058 1.316 1.708 2.06 2.167 2.485 2.787 3.078 3.45 3.725 26 0.684 0.856 1.058 1.315 1.706 2.056 2.162 2.479 2.779 3.067 3.435 3.707 27 0.684 0.855 1.057 1.314 1.703 2.052 2.158 2.473 2.371 3.057 3.421 3.69 28 0.683 0.855 1.056 1.313 1.701 2.048 2.154 2.467 2.763 3.047 3.408 3.674 29 0.683 0.B.54 1.055 1.311 1.699 2.045 2.15 2.462 2.756 3.038 3.396 3.659 30 0.683 0.854 1.055 1.31 1.697 2.042 2.147 2.457 2.7! 3.03 3.385 3.646 40 0.681 0.851 1.05 1.303 1.684 2.021 2.123 2.423 2.704 2.971 3.107 3.551 SO 0.679 0.849 1.047 1.299 1.676 2.009 2.109 2.403 2.678 2.937 3.261 3.496 GO 0.679 0.848 1.045 1.296 1.671 2.099 2.39 2.66 2.915 3.232 3.46 0.678 0.846 1.043 1.292 1.664 1.99 2.088 2.374 2.639 2.087 3.195 3.416 1010 0.677 0.845 1.042 1.29 1.66 1.984 2.081 2.364 2.626 2.871 3.174 3.39\fNEE-u: 5mm um um um um. um: um. um um um F Distribution at a = 0.05 1 3 S 12 161.45 199.50 215.71 224.58 240.16 243.99 243.91 249.05 254.32 18.51 19.00 19.16 16.25 19.30 19.33 19.37 19.41 19.45 19.50 10.13 3.55 9.20 9.12 TO1 3.94 384 8.74 B.64 7.71 6.94 6.59 6.39 6.26 6.10 5.91 5.77 5.63 6.61 5.79 5.41 5.19 3.05 1.95 182 1.53 1.36 5.99 5.14 4.76 1.53 1.39 4.28 1.15 100 3.6 5.59 1.74 4.12 3.97 3.87 1.71 3.57 1.41 3.21 5.32 1.46 4.07 184 3.69 3.50 3.44 3.20 3.12 2.92 5.12 1.26 380 3.37 3.23 107 2.90 2.71 1.96 1.10 3.71 1.31 3.22 2.91 2.74 2.54 10 11 184 1.90 3.59 3.36 3.20 3.09 2.95 2.79 2.61 2.40 12 4.75 3.49 3.20 3.11 3.00 2.50 2.69 2.50 2.30 13 4.67 3.80 341 3.02 2.92 2.7 2.60 2.42 2.21 14 1.60 1.74 3.11 2.96 2.85 2.70 2.53 2.35 2.13 15 1.54 180 3.29 2.06 2.90 2.79 26. 240 2.29 2.07 16 1.49 3.2 3.01 2.74 2.59 2.42 2.24 201 17 1.45 1.59 3.20 2.96 2 81 2.70 2.55 2.30 2.19 1.96 141 1.55 3.16 2.91 2.73 2.66 251 2.34 2.15 19 4.30 1.52 3.13 2.90 2.7. 2.63 2.48 2.31 2.11 1.80 20 1.35 1.49 3.10 2.87 2.71 2.60 2.45 2.26 2.08 18. 21 1.32 3.47 3.07 284 2.60 2.57 2.42 2.25 2.05 18 22 1.30 144 105 282 2.66 2.55 2.40 2.23 2.03 4.20 142 2 81 2.64 2.53 2.20 2.00 1.76 24 4.26 340 3.01 2.78 2.62 2.51 2.36 2.18 3.30 2.99 2.76 2.60 2.49 2.34 2.16 1.90 1.7; 25 1.24 26 4.22 1.37 2.90 2.74 2.59 2.47 232 2.15 1.95 1.69 27 1.21 1.35 2.90 2.73 2.57 2 46 2.30 2.13 1.93 20 4.20 134 2.95 2.71 256 2.44 2.29 2.12 1.91 1.65 1.10 3.33 2.91 2.70 2.54 2.43 2.20 2.10 1.90 29 1.32 2.92 2.6 2.53 242 2.27 2.09 1.89 1.62 30 1.17 40 108 1.23 284 261 2.45 2.34 2.18 200 1.79 1.00 1.15 2.76 2.52 2:37 2.25 2.10 192 1.70 1.39 120 2.92 107 2.68 2.45 2 29 2.17 2102 161 1.25 184 1.99 2.60 1.21 2.09 1.75 1.52 1.00
