Answered step by step
Verified Expert Solution
Question
1 Approved Answer
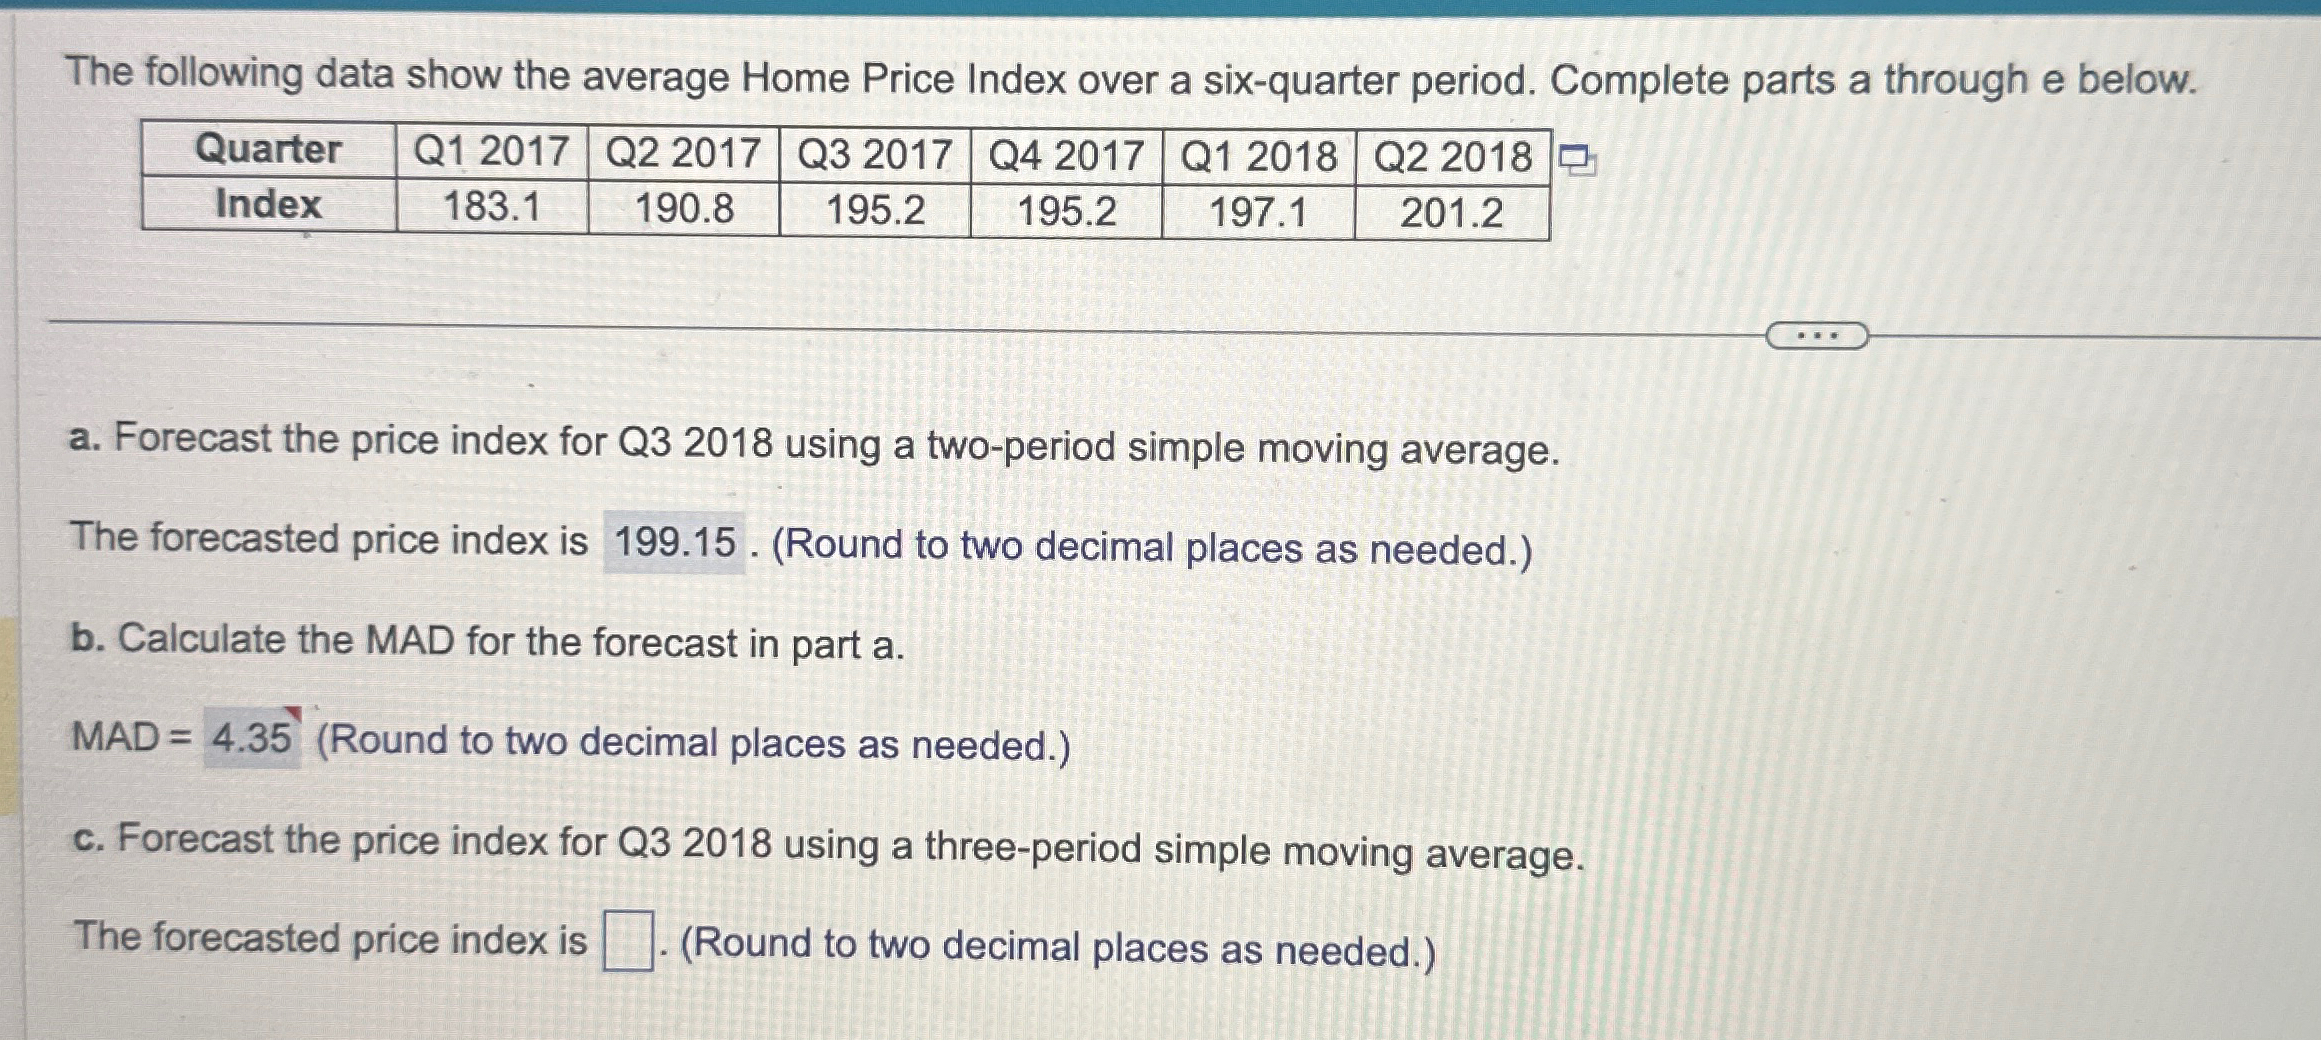
The following data show the average Home Price Index over a six - quarter period. Complete parts a through e below. table [ [
The following data show the average Home Price Index over a sixquarter period. Complete parts a through e below.
tableQuarterQQQQQQIndex
a Forecast the price index for Q using a twoperiod simple moving average.
The forecasted price index is Round to two decimal places as needed.
b Calculate the MAD for the forecast in part a
MAD Round to two decimal places as needed.
c Forecast the price index for Q using a threeperiod simple moving average.
The forecasted price index is Round to two decimal places as needed.
CALCULATE MAD FOR PART C

Step by Step Solution
There are 3 Steps involved in it
Step: 1

Get Instant Access to Expert-Tailored Solutions
See step-by-step solutions with expert insights and AI powered tools for academic success
Step: 2

Step: 3

Ace Your Homework with AI
Get the answers you need in no time with our AI-driven, step-by-step assistance
Get Started


