Answered step by step
Verified Expert Solution
Question
1 Approved Answer
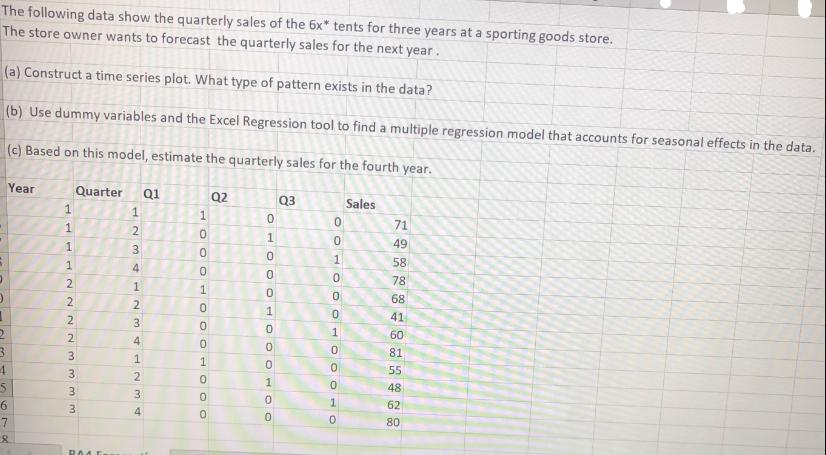
The following data show the quarterly sales of the 6x* tents for three years at a sporting goods store. The store owner wants to

The following data show the quarterly sales of the 6x* tents for three years at a sporting goods store. The store owner wants to forecast the quarterly sales for the next year. (a) Construct a time series plot. What type of pattern exists in the data? (b) Use dummy variables and the Excel Regression tool to find a multiple regression model that accounts for seasonal effects in the data. (c) Based on this model, estimate the quarterly sales for the fourth year. D 3 4 5 Year 6 8 1 1T 1 1 2 222 m m m m Quarter 3 3 3 3 PAKE 12 341N3 2 41234 Q1 1 0 0 0 1 0 0 0 HOOO 0 Q2 0 100 0 1 0 OOHOO 0 0 1 0 0 Q3 OOHOOOOOOO 0 0 0 Sales 71 49 58 78 68 41 60 81 55 48 62 80
Step by Step Solution
★★★★★
3.44 Rating (154 Votes )
There are 3 Steps involved in it
Step: 1
forecasting quarterly sales of 6x tents for a sporting goods store over the next year The data provi...
Get Instant Access to Expert-Tailored Solutions
See step-by-step solutions with expert insights and AI powered tools for academic success
Step: 2

Step: 3

Ace Your Homework with AI
Get the answers you need in no time with our AI-driven, step-by-step assistance
Get Started


