

Answered step by step
Verified Expert Solution
Question
1 Approved Answer
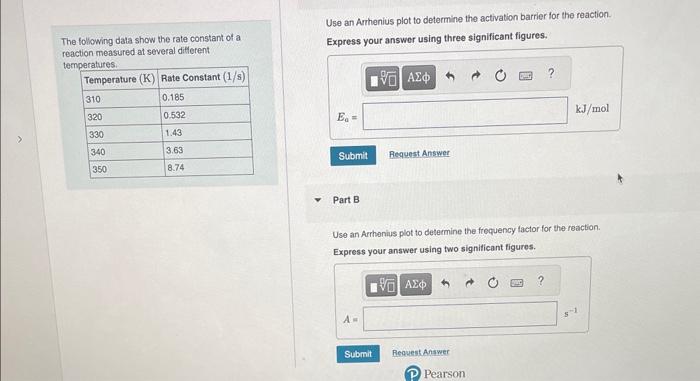
The following data show the rate constant of a reaction measured at several different termarahirac. Part B Use an Arrhenius plot to determine the frequency
Step by Step Solution
There are 3 Steps involved in it
Step: 1

Get Instant Access to Expert-Tailored Solutions
See step-by-step solutions with expert insights and AI powered tools for academic success
Step: 2

Step: 3
Ace Your Homework with AI
Get the answers you need in no time with our AI-driven, step-by-step assistance
Get Started
Fundamentals Of General Organic And Biological Chemistry
Authors: John McMurry, David S. Ballantine
8th Edition
0134218329, 978-0134218328