Answered step by step
Verified Expert Solution
Question
1 Approved Answer
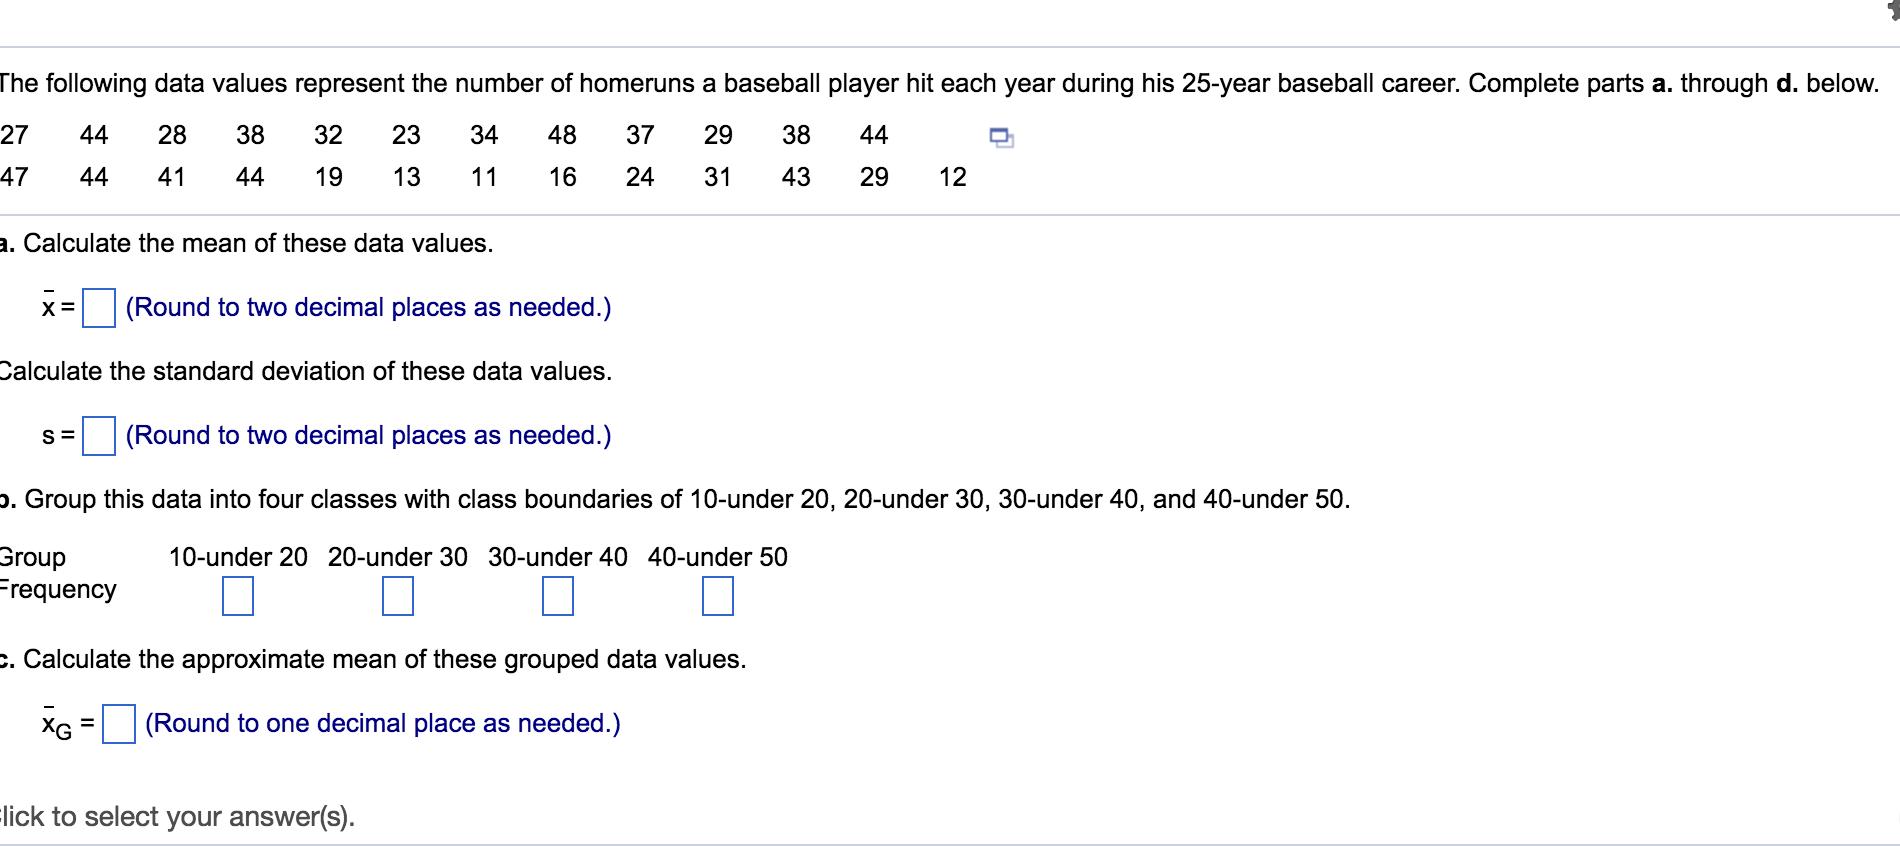
The following data values represent the number of homeruns a baseball player hit each year during his 25-year baseball career. Complete parts a. through


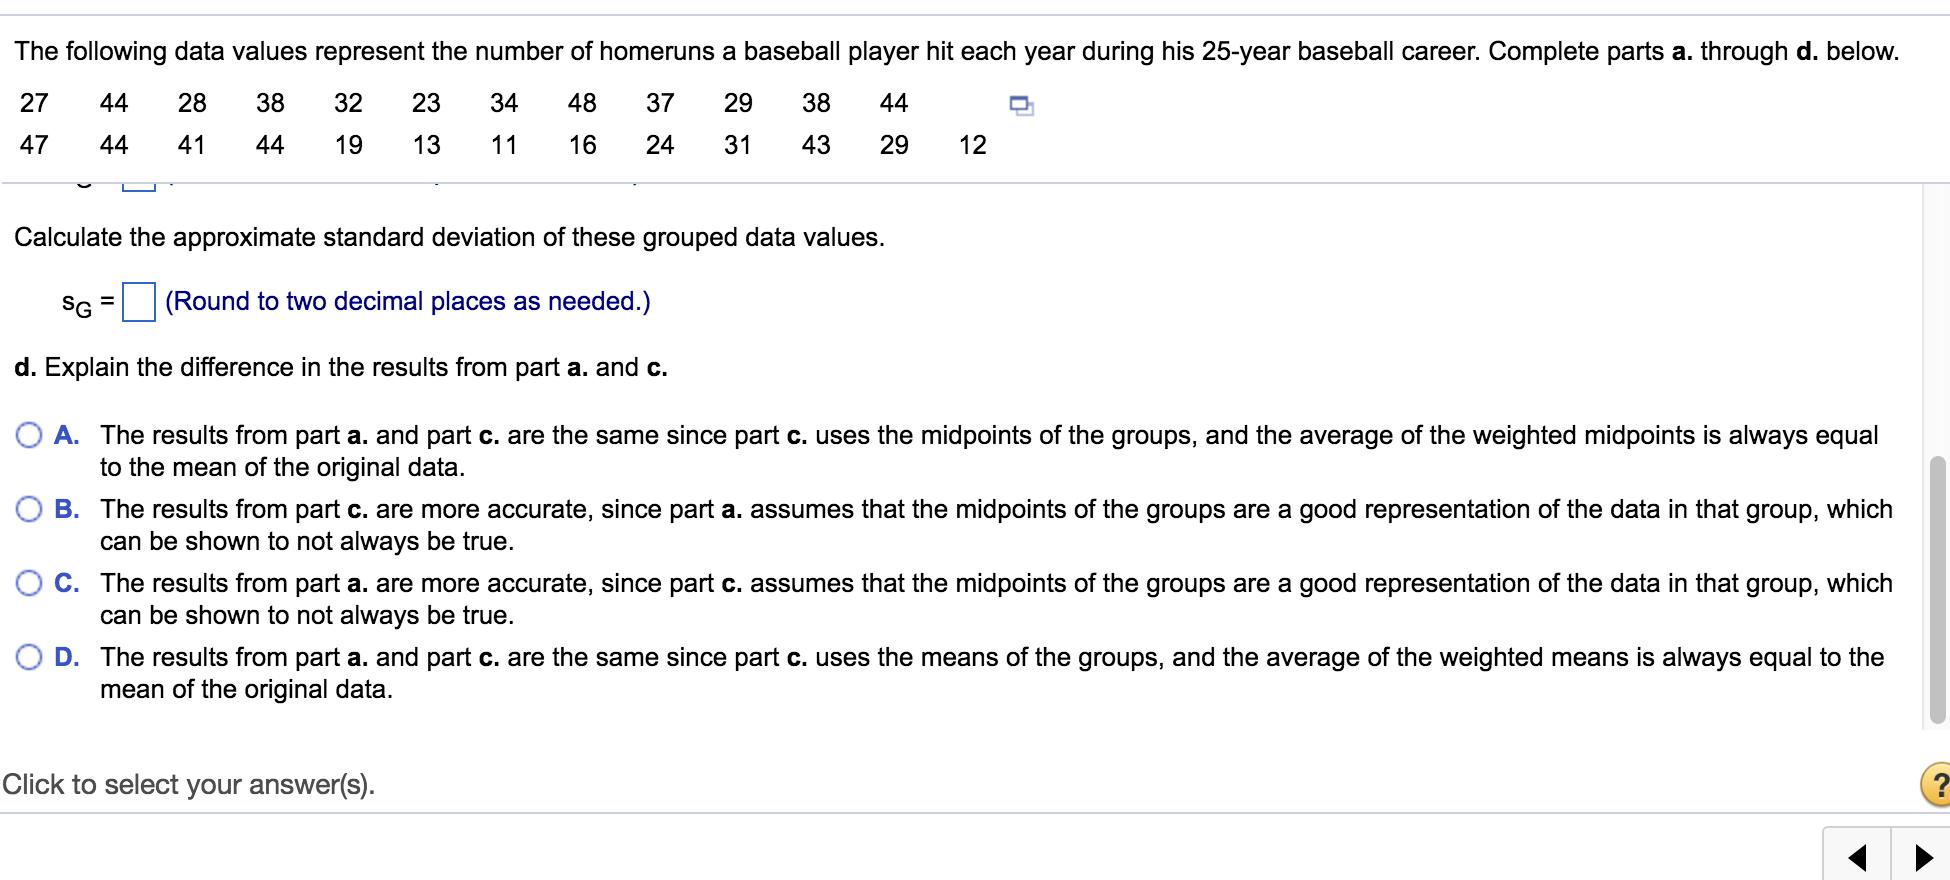
The following data values represent the number of homeruns a baseball player hit each year during his 25-year baseball career. Complete parts a. through d. below. 27 44 28 38 32 23 34 48 37 29 38 44 47 44 41 44 19 13 11 16 24 31 43 29 12 a. Calculate the mean of these data values. X = (Round to two decimal places as needed.) Calculate the standard deviation of these data values. S= (Round to two decimal places as needed.) o. Group this data into four classes with class boundaries of 10-under 20, 20-under 30, 30-under 40, and 40-under 50. Group Frequency 10-under 20 20-under 30 30-under 40 40-under 50 c. Calculate the approximate mean of these grouped data values. XG (Round to one decimal place as needed.) %3D Elick to select your answer(s). The following data values represent the number of homeruns a baseball player hit each year during his 25-year baseball career. Complete parts a. through d. below. 27 44 28 38 32 23 34 48 37 29 38 44 47 44 41 44 19 13 11 16 24 31 43 29 12 Calculate the approximate standard deviation of these grouped data values. SG = (Round to two decimal places as needed.) d. Explain the difference in the results from part a. and c. O A. The results from part a. and part c. are the same since part c. uses the midpoints of the groups, and the average of the weighted midpoints is always equal to the mean of the original data. B. The results from part c. are more accurate, since part a. assumes that the midpoints of the groups are a good representation of the data in that group, which can be shown to not always be true. O C. The results from part a. are more accurate, since part c. assumes that the midpoints of the groups are a good representation of the data in that group, which can be shown to not always be true. O D. The results from part a. and part c. are the same since part c. uses the means of the groups, and the average of the weighted means is always equal to the mean of the original data. Click to select your answer(s).
Step by Step Solution
★★★★★
3.52 Rating (159 Votes )
There are 3 Steps involved in it
Step: 1
Answere From the given information The followi...
Get Instant Access to Expert-Tailored Solutions
See step-by-step solutions with expert insights and AI powered tools for academic success
Step: 2

Step: 3

Ace Your Homework with AI
Get the answers you need in no time with our AI-driven, step-by-step assistance
Get Started


