Answered step by step
Verified Expert Solution
Link Copied!

Question

1 Approved Answer

The following data were collected for the steady flow of water in a concrete circular pipe: Use multiple linear regression to fit the following model
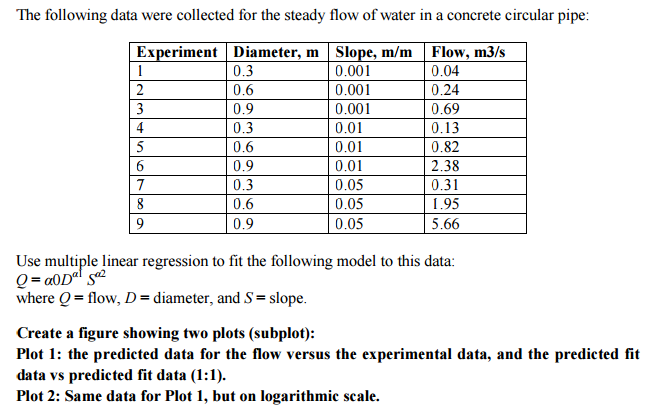
image text in transcribed

The following data were collected for the steady flow of water in a concrete circular pipe: Use multiple linear regression to fit the following model to this data: Q = alpha0D^a S^a2 where Q = flow, D = diameter, and S = slope. Create a figure showing two plots (subplot): Plot 1: the predicted data for the flow versus the experimental data, and the predicted fit data vs predicted fit data (1:1). Plot 2: Same data for Plot 1, but on logarithmic scale. The following data were collected for the steady flow of water in a concrete circular pipe: Use multiple linear regression to fit the following model to this data: Q = alpha0D^a S^a2 where Q = flow, D = diameter, and S = slope. Create a figure showing two plots (subplot): Plot 1: the predicted data for the flow versus the experimental data, and the predicted fit data vs predicted fit data (1:1). Plot 2: Same data for Plot 1, but on logarithmic scale

Step by Step Solution

There are 3 Steps involved in it

Step: 1

blur-text-image

Get Instant Access to Expert-Tailored Solutions

See step-by-step solutions with expert insights and AI powered tools for academic success

Step: 2

blur-text-image_2

Step: 3

blur-text-image_3

Ace Your Homework with AI

Get the answers you need in no time with our AI-driven, step-by-step assistance

Get Started

Recommended Textbook for

Excel As Your Database

Authors: Paul Cornell

1st Edition

1590597516, 978-1590597514

More Books

Students also viewed these Databases questions

Question

Why is the System Build Process an iterative process?

Answered: 1 week ago