

Answered step by step
Verified Expert Solution
Question
1 Approved Answer
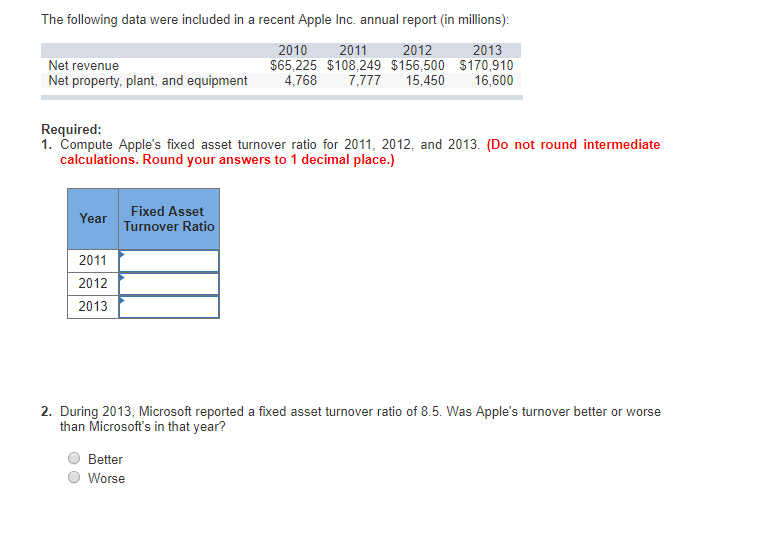
The following data were included in a recent Apple Inc. annual report (in millions): 2010 2011 2012 2013 $65,225 $108,249 $156,500 $170,910 Net revenue Net
Step by Step Solution
There are 3 Steps involved in it
Step: 1

Get Instant Access to Expert-Tailored Solutions
See step-by-step solutions with expert insights and AI powered tools for academic success
Step: 2

Step: 3
Ace Your Homework with AI
Get the answers you need in no time with our AI-driven, step-by-step assistance
Get Started
The Safe Hiring Audit The Employers Guide To Implementing A Safe Hiring Program
Authors: Lester S. Rosen
1st Edition
1889150517, 978-1889150512