

Answered step by step
Verified Expert Solution
Question
1 Approved Answer
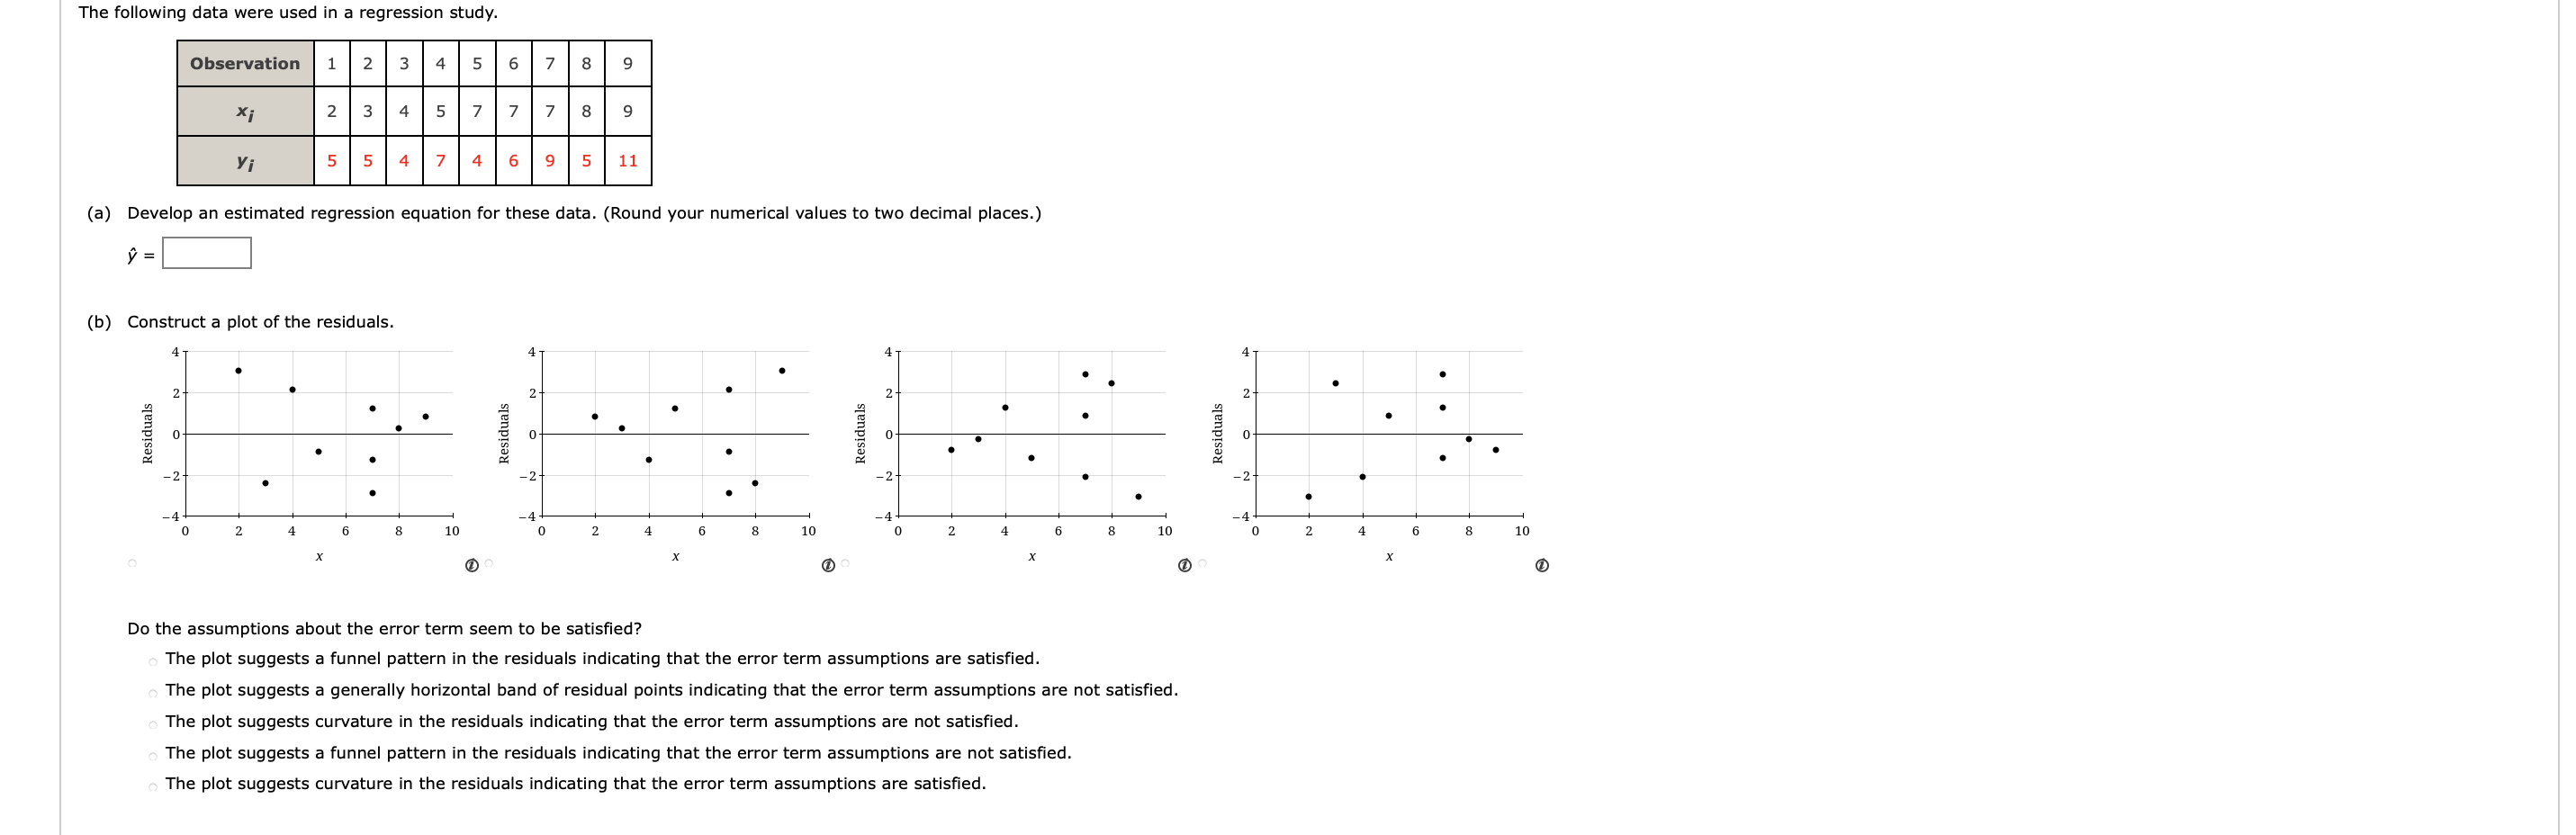
The following data were used in a regression study. Observation 1 2 5 6 7 8 9 X 3 8 9 yi 5 5 11
Step by Step Solution
There are 3 Steps involved in it
Step: 1

Get Instant Access to Expert-Tailored Solutions
See step-by-step solutions with expert insights and AI powered tools for academic success
Step: 2

Step: 3
Ace Your Homework with AI
Get the answers you need in no time with our AI-driven, step-by-step assistance
Get Started
Classical Mechanics
Authors: R Douglas Gregory
1st Edition
0511159242, 9780511159244