the following dates represent the present of the voting age in each voting year from 1960 to 2008 , as well as the number of voters who votes in each year in millions.
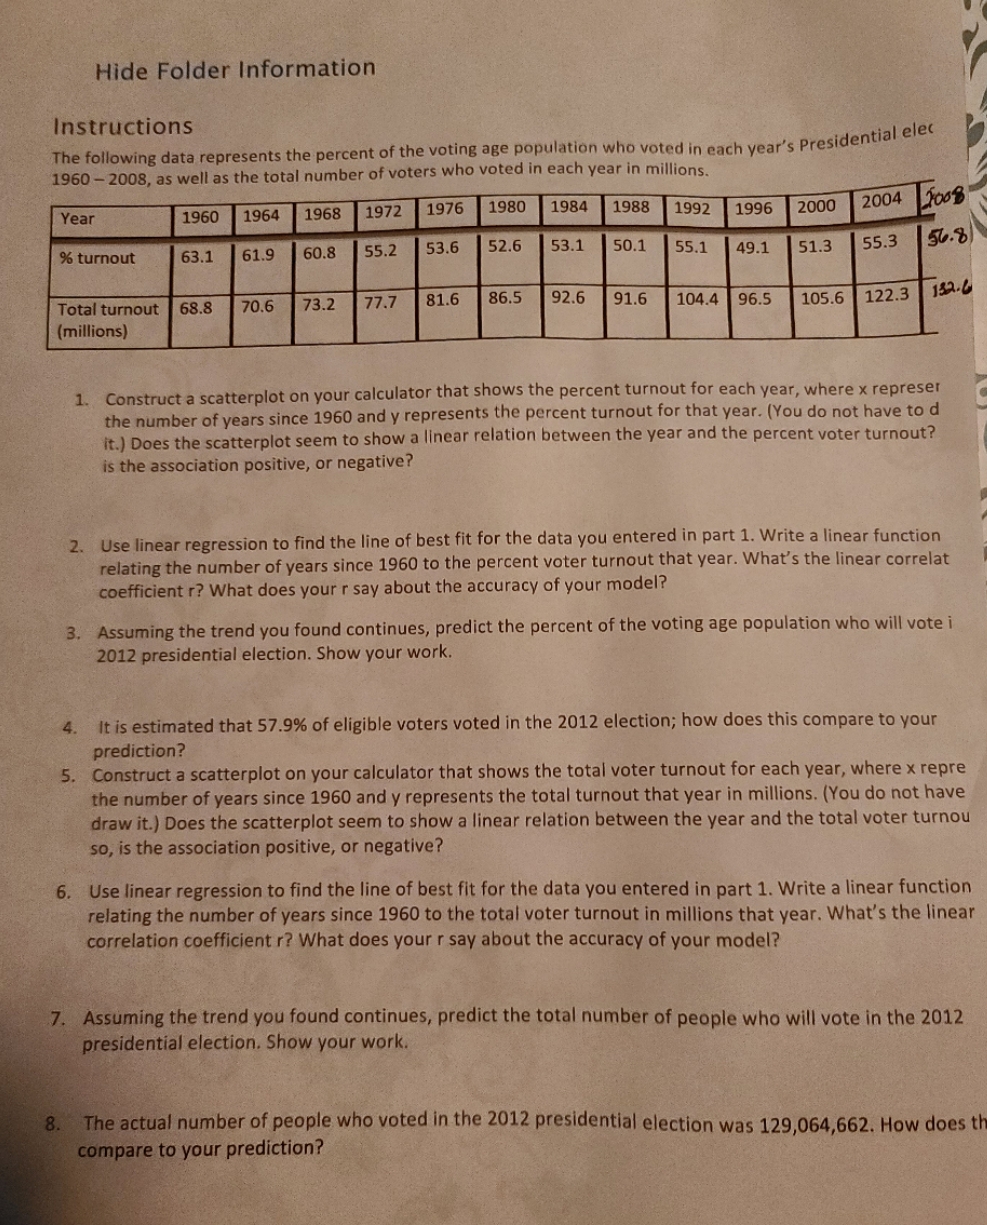
Hide Folder Information Instructions The following data represents the percent of the voting age population who voted in each year's Presidential elec 1960 -2008, as well as the total number of voters who voted in each year in millions. Year 1960 1964 1968 1972 1976 1980 1984 1988 1992 1996 2000 2004 % turnout 63.1 61.9 60.8 55.2 53.6 52.6 53.1 50.1 55.1 49.1 51.3 55.3 56.8 Total turnout 68.8 70.6 73.2 77.7 81.6 86.5 92.6 91.6 104.4 96.5 105.6 122.3 132.6 (millions) 1. Construct a scatterplot on your calculator that shows the percent turnout for each year, where x represer the number of years since 1960 and y represents the percent turnout for that year. (You do not have to d it.) Does the scatterplot seem to show a linear relation between the year and the percent voter turnout? is the association positive, or negative? 2. Use linear regression to find the line of best fit for the data you entered in part 1. Write a linear function relating the number of years since 1960 to the percent voter turnout that year. What's the linear correlat coefficient r? What does your r say about the accuracy of your model? B. Assuming the trend you found continues, predict the percent of the voting age population who will vote i 2012 presidential election. Show your work. It is estimated that 57.9% of eligible voters voted in the 2012 election; how does this compare to your prediction? 5. Construct a scatterplot on your calculator that shows the total voter turnout for each year, where x repre the number of years since 1960 and y represents the total turnout that year in millions. (You do not have draw it.) Does the scatterplot seem to show a linear relation between the year and the total voter turnou so, is the association positive, or negative? 6. Use linear regression to find the line of best fit for the data you entered in part 1. Write a linear function relating the number of years since 1960 to the total voter turnout in millions that year. What's the linear correlation coefficient r? What does your r say about the accuracy of your model? 7. Assuming the trend you found continues, predict the total number of people who will vote in the 2012 presidential election. Show your work. 8. The actual number of people who voted in the 2012 presidential election was 129,064,662. How does th compare to your prediction