Answered step by step
Verified Expert Solution
Question
1 Approved Answer
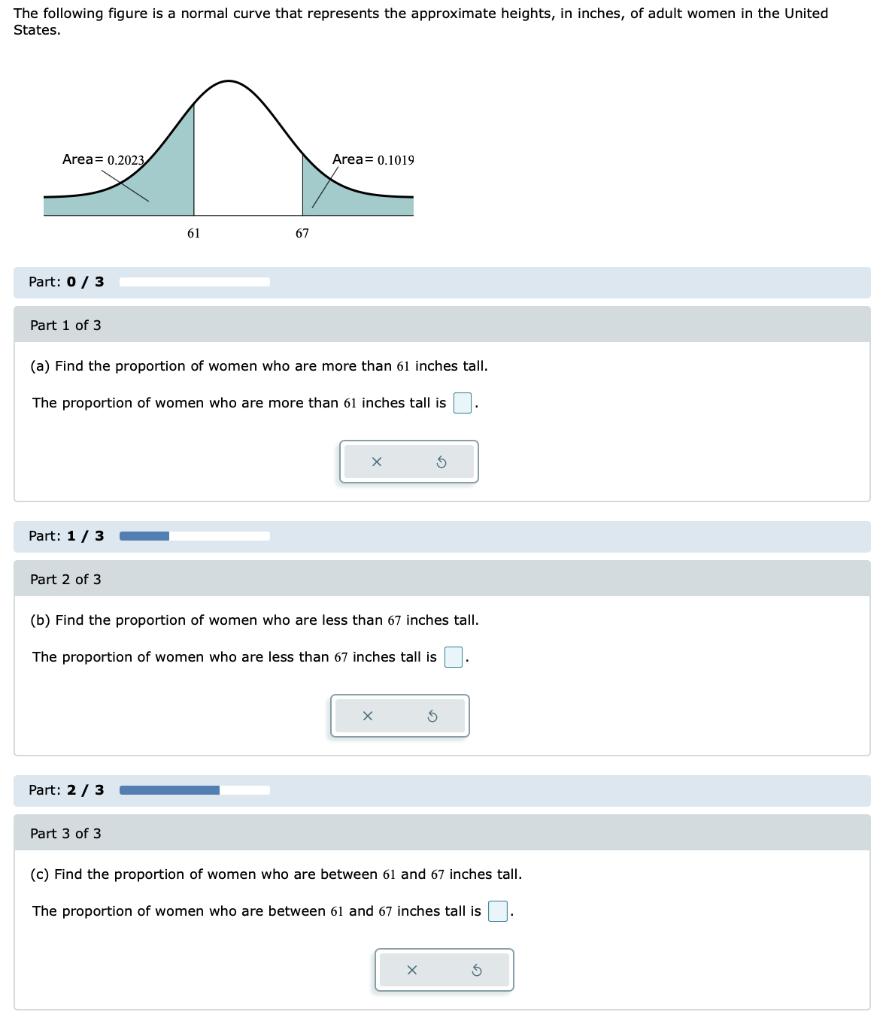
The following figure is a normal curve that represents the approximate heights, in inches, of adult women in the United States. Area= 0.2023 Area=


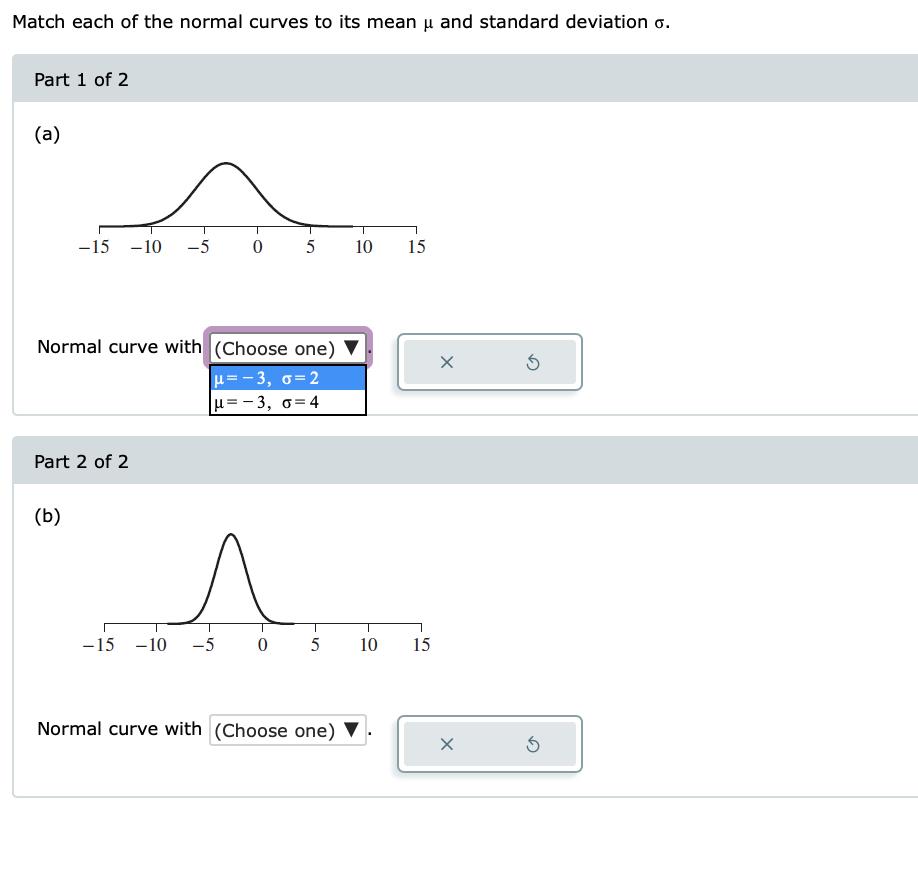
The following figure is a normal curve that represents the approximate heights, in inches, of adult women in the United States. Area= 0.2023 Area= 0.1019 61 67 Part: 0/ 3 Part 1 of 3 (a) Find the proportion of women who are more than 61 inches tall. The proportion of women who are more than 61 inches tall is Part: 1/3 Part 2 of 3 (b) Find the proportion of women who are less than 67 inches tall. The proportion of women who are less than 67 inches tall is Part: 2/ 3 Part 3 of 3 (c) Find proportion of women who are between 61 and 67 inches tall. The proportion of women who are between 61 and 67 inches tall is Match each of the normal curves to its mean u and standard deviation o. Part 1 of 2 (a) -15 -10 -5 5 10 15 Normal curve with (Choose one) u=- 3, o=2 u=- 3, o=4 Part 2 of 2 (b) -15 -10 -5 10 15 Normal curve with (Choose one)
Step by Step Solution
★★★★★
3.45 Rating (161 Votes )
There are 3 Steps involved in it
Step: 1
02023 01019 61 67 ...
Get Instant Access to Expert-Tailored Solutions
See step-by-step solutions with expert insights and AI powered tools for academic success
Step: 2

Step: 3

Ace Your Homework with AI
Get the answers you need in no time with our AI-driven, step-by-step assistance
Get Started


