Answered step by step
Verified Expert Solution
Link Copied!

Question

1 Approved Answer

The following figure shows plots of monthly rates of return and the stock market for two stocks. TA-1, TB-1 . Im-rf I'm-f . Required: a.
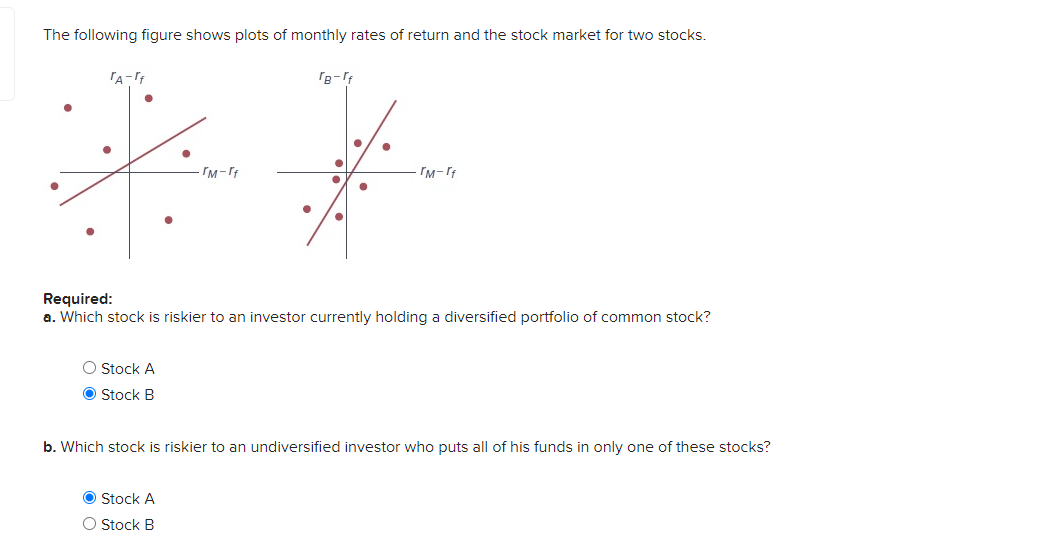
image text in transcribed

The following figure shows plots of monthly rates of return and the stock market for two stocks. TA-1, TB-1 . Im-rf I'm-f . Required: a. Which stock is riskier to an investor currently holding a diversified portfolio of common stock? O Stock A Stock B b. Which stock is riskier to an undiversified investor who puts all of his funds in only one of these stocks? O Stock A O Stock B

Step by Step Solution

There are 3 Steps involved in it

Step: 1

blur-text-image

Get Instant Access to Expert-Tailored Solutions

See step-by-step solutions with expert insights and AI powered tools for academic success

Step: 2

blur-text-image_2

Step: 3

blur-text-image_3

Ace Your Homework with AI

Get the answers you need in no time with our AI-driven, step-by-step assistance

Get Started

Recommended Textbook for

The Freedmans Handbook A Practical Guide To Wealth

Authors: Wilfred Brown, Adrian Tullock

1st Edition

1478748400, 978-1478748403

More Books

Students also viewed these Finance questions

Question

1. What are your creative strengths?

Answered: 1 week ago

Question

What metaphors might describe how we work together?

Answered: 1 week ago