Answered step by step
Verified Expert Solution
Question
1 Approved Answer
The following figure shows the relationship between operating cash flow and sales volume using the three break-even measures. Please answer to show names of variables
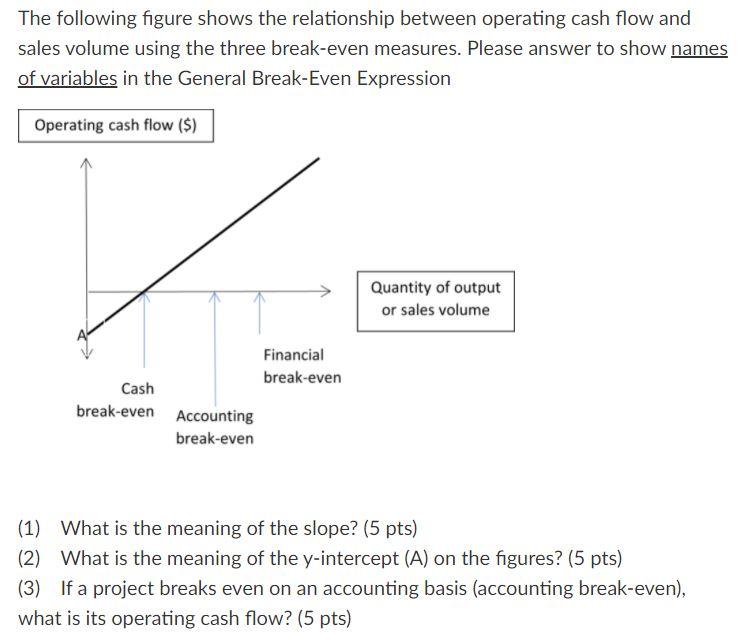
The following figure shows the relationship between operating cash flow and sales volume using the three break-even measures. Please answer to show names of variables in the General Break-Even Expression Operating cash flow ($) Quantity of output or sales volume Financial break-even Cash break-even Accounting break-even (1) What is the meaning of the slope? (5 pts) (2) What is the meaning of the y-intercept (A) on the figures? (5 pts) (3) If a project breaks even on an accounting basis (accounting break-even), what is its operating cash flow? (5 pts) The following figure shows the relationship between operating cash flow and sales volume using the three break-even measures. Please answer to show names of variables in the General Break-Even Expression Operating cash flow ($) Quantity of output or sales volume Financial break-even Cash break-even Accounting break-even (1) What is the meaning of the slope? (5 pts) (2) What is the meaning of the y-intercept (A) on the figures? (5 pts) (3) If a project breaks even on an accounting basis (accounting break-even), what is its operating cash flow? (5 pts)
Step by Step Solution
There are 3 Steps involved in it
Step: 1
Get Instant Access to Expert-Tailored Solutions
See step-by-step solutions with expert insights and AI powered tools for academic success
Step: 2
Step: 3
Ace Your Homework with AI
Get the answers you need in no time with our AI-driven, step-by-step assistance
Get Started