

Answered step by step
Verified Expert Solution
Question
1 Approved Answer
the following figures come from a Report on the Census of Production Textile Machinery and Accessories Establishments Net Output Nos. (in thousands of cedis) 48
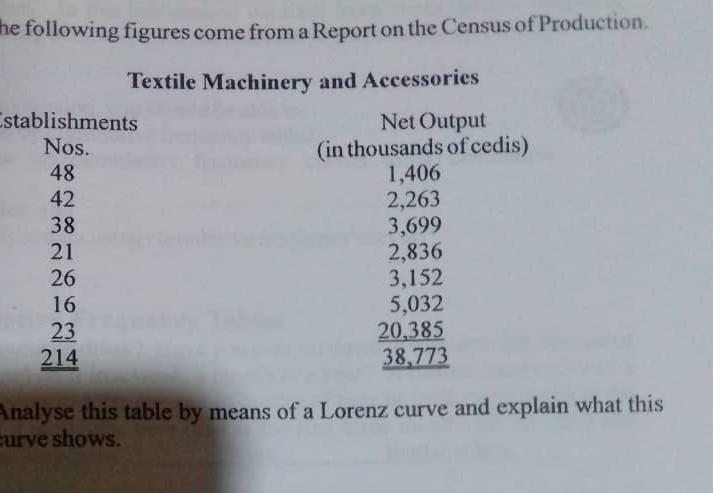
the following figures come from a Report on the Census of Production Textile Machinery and Accessories Establishments Net Output Nos. (in thousands of cedis) 48 1,406 42 2,263 38 3,699 21 2,836 26 3,152 16 5,032 23 20,385 214 38,773 Analyse this table by means of a Lorenz curve and explain what this curve shows. the following figures come from a Report on the Census of Production Textile Machinery and Accessories Establishments Net Output Nos. (in thousands of cedis) 48 1,406 42 2,263 38 3,699 21 2,836 26 3,152 16 5,032 23 20,385 214 38,773 Analyse this table by means of a Lorenz curve and explain what this curve shows
Step by Step Solution
There are 3 Steps involved in it
Step: 1

Get Instant Access to Expert-Tailored Solutions
See step-by-step solutions with expert insights and AI powered tools for academic success
Step: 2

Step: 3
Ace Your Homework with AI
Get the answers you need in no time with our AI-driven, step-by-step assistance
Get Started
Methods And Finance
Authors: Emiliano Ippoliti, Ping Chen
1st Edition
3319498711, 978-3319498713