Question
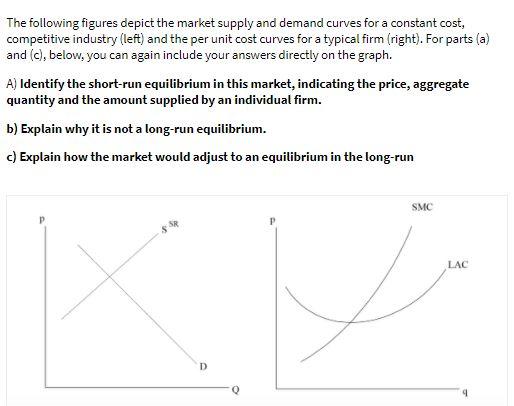
The following figures depict the market supply and demand curves for a constant cost, competitive industry (left) and the per unit cost curves for

The following figures depict the market supply and demand curves for a constant cost, competitive industry (left) and the per unit cost curves for a typical firm (right). For parts (a) and (c), below, you can again include your answers directly on the graph. A) Identify the short-run equilibrium in this market, indicating the price, aggregate quantity and the amount supplied by an individual firm. b) Explain why it is not a long-run equilibrium. c) Explain how the market would adjust to an equilibrium in the long-run SMC P. LAC D
Step by Step Solution
3.48 Rating (161 Votes )
There are 3 Steps involved in it
Step: 1
Answer 3a Short run equilibrium is at point E Equili...
Get Instant Access to Expert-Tailored Solutions
See step-by-step solutions with expert insights and AI powered tools for academic success
Step: 2

Step: 3

Ace Your Homework with AI
Get the answers you need in no time with our AI-driven, step-by-step assistance
Get StartedRecommended Textbook for
Financial Algebra advanced algebra with financial applications
Authors: Robert K. Gerver
1st edition
978-1285444857, 128544485X, 978-0357229101, 035722910X, 978-0538449670
Students also viewed these Accounting questions
Question
Answered: 1 week ago
Question
Answered: 1 week ago
Question
Answered: 1 week ago
Question
Answered: 1 week ago
Question
Answered: 1 week ago
Question
Answered: 1 week ago
Question
Answered: 1 week ago
Question
Answered: 1 week ago
Question
Answered: 1 week ago
Question
Answered: 1 week ago
Question
Answered: 1 week ago
Question
Answered: 1 week ago
Question
Answered: 1 week ago
Question
Answered: 1 week ago
Question
Answered: 1 week ago
Question
Answered: 1 week ago
Question
Answered: 1 week ago
Question
Answered: 1 week ago
Question
Answered: 1 week ago
Question
Answered: 1 week ago
Question
Answered: 1 week ago
View Answer in SolutionInn App


