Answered step by step
Verified Expert Solution
Question
1 Approved Answer
The following financial data is an extract from the website of yahoo.com.hk in respect to the financial ratios of a manufacturing company listed in
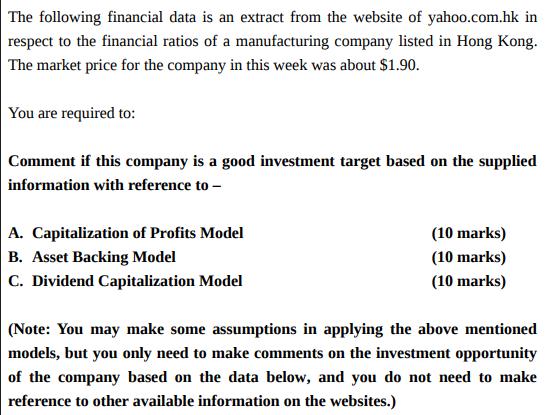
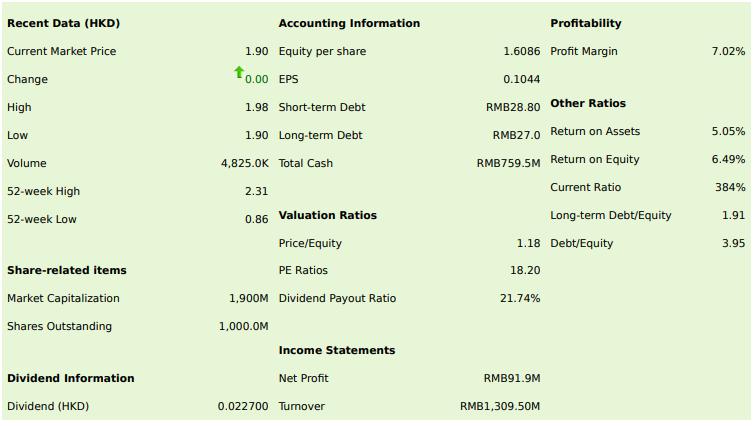
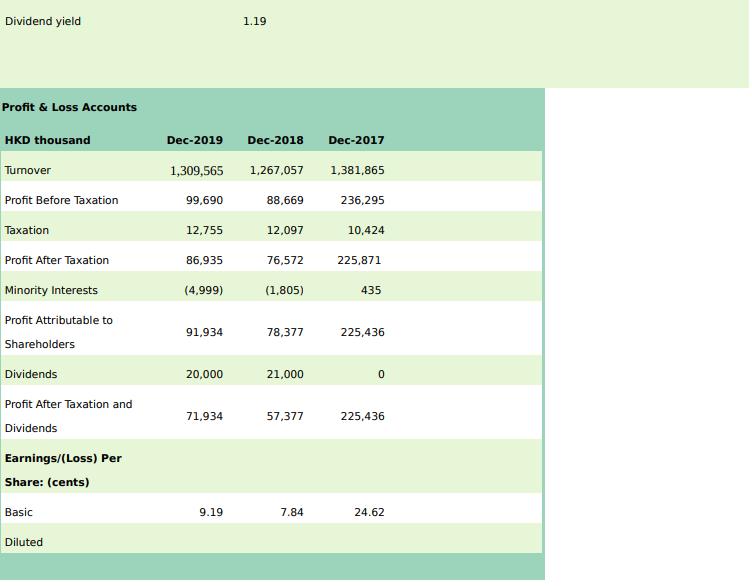
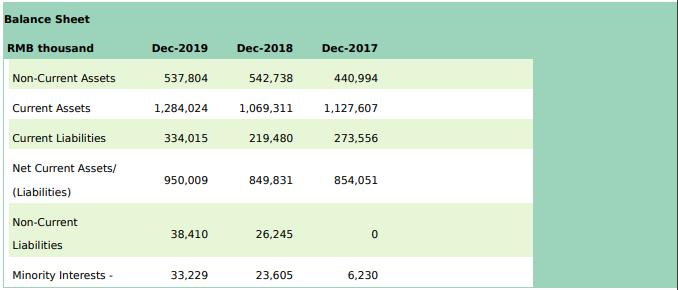
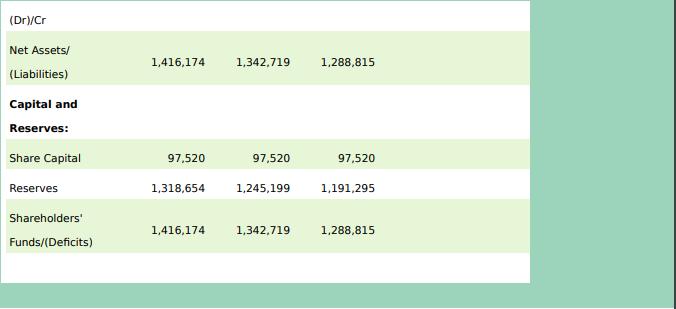
The following financial data is an extract from the website of yahoo.com.hk in respect to the financial ratios of a manufacturing company listed in Hong Kong. The market price for the company in this week was about $1.90. You are required to: Comment if this company is a good investment target based on the supplied information with reference to - A. Capitalization of Profits Model B. Asset Backing Model C. Dividend Capitalization Model (10 marks) (10 marks) (10 marks) (Note: You may make some assumptions in applying the above mentioned models, but you only need to make comments on the investment opportunity of the company based on the data below, and you do not need to make reference to other available information on the websites.) Recent Data (HKD) Current Market Price Change High Low Volume 52-week High 52-week Low Share-related items Market Capitalization Shares Outstanding Dividend Information Dividend (HKD) Accounting Information 1.90 Equity per share 0.00 0.00 EPS 1.98 Short-term Debt 1.90 Long-term Debt 4,825.0K Total Cash 2.31 0.86 Valuation Ratios Price/Equity PE Ratios 1,900M Dividend Payout Ratio 1,000.0M Income Statements Net Profit 0.022700 Turnover Profitability 1.6086 Profit Margin 0.1044 RMB28.80 RMB27.0 RMB759.5M 18.20 1.18 Debt/Equity 21.74% RMB91.9M Other Ratios Return on Assets Return on Equity Current Ratio RMB1,309.50M Long-term Debt/Equity 7.02% 5.05% 6.49% 384% 1.91 3.95 Dividend yield Profit & Loss Accounts HKD thousand Turnover Profit Before Taxation Taxation Profit After Taxation Minority Interests Profit Attributable to Shareholders Dividends Profit After Taxation and Dividends Earnings/(Loss) Per Share: (cents) Basic Diluted Dec-2019 Dec-2018 Dec-2017 1,309,565 99,690 12,755 86,935 (4,999) 91,934 20,000 71,934 1.19 9.19 1,267,057 88,669 12,097 76,572 (1,805) 78,377 21,000 57,377 7.84 1,381,865 236,295 10,424 225,871 435 225,436 0 225,436 24.62 Balance Sheet RMB thousand Non-Current Assets Current Assets Current Liabilities Net Current Assets/ (Liabilities) Non-Current Liabilities Minority Interests - Dec-2019 537,804 1,284,024 334,015 950,009 38,410 33,229 Dec-2018 542,738 1,069,311 219,480 849,831 26,245 23,605 Dec-2017 440,994 1,127,607 273,556 854,051 6,230 (Dr)/Cr Net Assets/ (Liabilities) Capital and Reserves: Share Capital Reserves Shareholders' Funds/(Deficits) 1,416,174 97,520 1,342,719 1,416,174 97,520 1,318,654 1,245,199 1,342,719 1,288,815 97,520 1,191,295 1,288,815
Step by Step Solution
There are 3 Steps involved in it
Step: 1
Based on the information provided A Capitalization of Profits Model Using this model the fair value ...
Get Instant Access to Expert-Tailored Solutions
See step-by-step solutions with expert insights and AI powered tools for academic success
Step: 2

Step: 3

Ace Your Homework with AI
Get the answers you need in no time with our AI-driven, step-by-step assistance
Get Started


