

Answered step by step
Verified Expert Solution
Question
1 Approved Answer
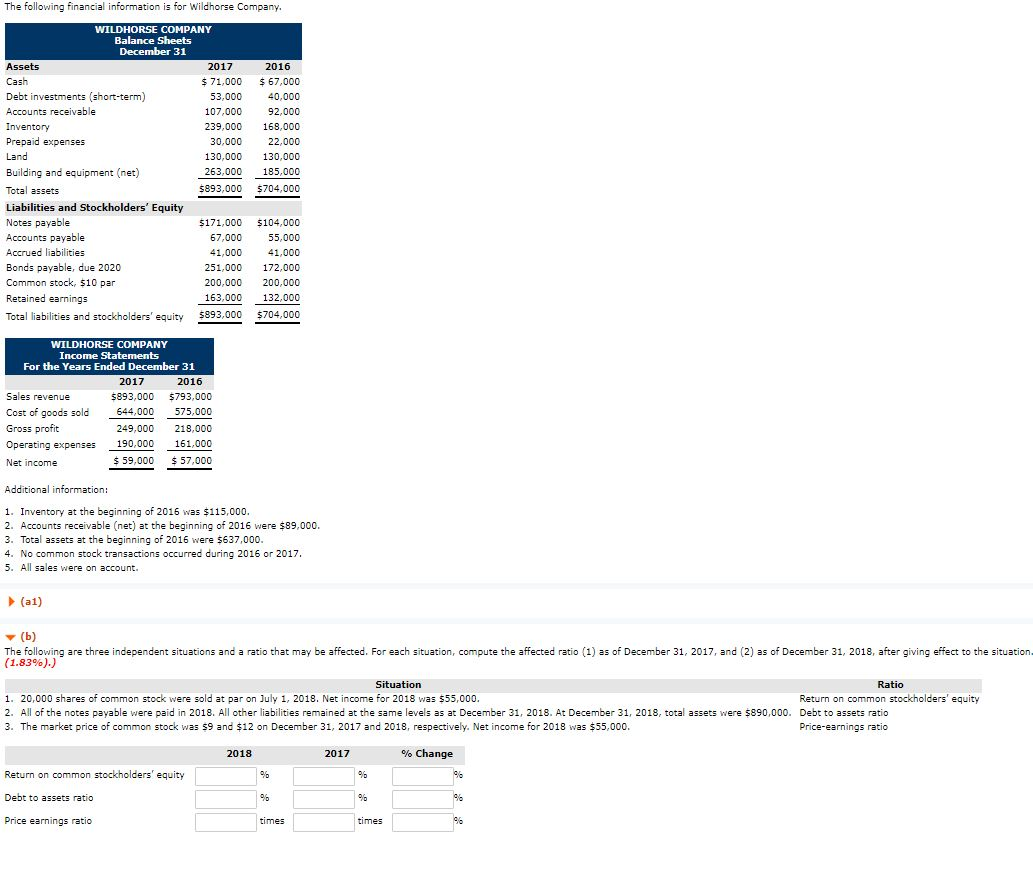
The following financial information is for Wildhorse Company. WILDHORSE COMPANY Balance Sheets December 31 Assets 2017 Cash $ 71,000 Debt investments (short-term) 53,000 Accounts receivable
Step by Step Solution
There are 3 Steps involved in it
Step: 1

Get Instant Access to Expert-Tailored Solutions
See step-by-step solutions with expert insights and AI powered tools for academic success
Step: 2

Step: 3
Ace Your Homework with AI
Get the answers you need in no time with our AI-driven, step-by-step assistance
Get Started
Finding Your Granite My Four Cornerstones Of Personal Leadership Security Audit And Leadership Series
Authors: Douglas P. Pflug
1st Edition
1032034114, 978-1032034119