

Question
The following financial statements apply to Harris Company: Year 2 Year 1 Revenues $ 220,400 $ 181,700 Expenses Cost of goods sold 124,500 101,400 Selling
The following financial statements apply to Harris Company:
| Year 2 | Year 1 | ||||||
| Revenues | $ | 220,400 | $ | 181,700 | |||
| Expenses | |||||||
| Cost of goods sold | 124,500 | 101,400 | |||||
| Selling expenses | 20,800 | 18,800 | |||||
| General and administrative expenses | 10,600 | 9,600 | |||||
| Interest expense | 2,500 | 2,500 | |||||
| Income tax expense | 19,300 | 16,200 | |||||
| Total expenses | 177,700 | 148,500 | |||||
| Net income | $ | 42,700 | $ | 33,200 | |||
| Assets | |||||||
| Current assets | |||||||
| Cash | $ | 5,000 | $ | 6,400 | |||
| Marketable securities | 2,200 | 2,200 | |||||
| Accounts receivable | 36,500 | 31,800 | |||||
| Inventories | 101,800 | 94,400 | |||||
| Prepaid expenses | 3,700 | 2,700 | |||||
| Total current assets | 149,200 | 137,500 | |||||
| Plant and equipment (net) | 105,400 | 105,400 | |||||
| Intangibles | 20,700 | 0 | |||||
| Total assets | $ | 275,300 | $ | 242,900 | |||
| Liabilities and Stockholders Equity | |||||||
| Liabilities | |||||||
| Current liabilities | |||||||
| Accounts payable | $ | 39,900 | $ | 34,100 | |||
| Other | 16,100 | 16,600 | |||||
| Total current liabilities | 56,000 | 50,700 | |||||
| Bonds payable | 64,500 | 65,500 | |||||
| Total liabilities | 120,500 | 116,200 | |||||
| Stockholders equity | |||||||
| Common stock (41,000 shares) | 114,700 | 114,700 | |||||
| Retained earnings | 40,100 | 12,000 | |||||
| Total stockholders equity | 154,800 | 126,700 | |||||
| Total liabilities and stockholders equity | $ | 275,300 | $ | 242,900 | |||
Required Calculate the following ratios for Year 1 and Year 2. Since opening balance numbers are not presented do not use averages when calculating the ratios for Year 1. Instead, use the number presented on the Year 1 balance sheet. a. Net margin. (Round your answers to 2 decimal places.) b. Return on investment. (Round your answers to 2 decimal places.) c. Return on equity. (Round your answers to 2 decimal places.) d. Earnings per share. (Round your answers to 2 decimal places.) e. Price-earnings ratio (market prices at the end of Year 1 and Year 2 were $6.07 and $4.84, respectively). (Round your intermediate calculations and final answers to 2 decimal places.) f. Book value per share of common stock. (Round your answers to 2 decimal places.) g. Times interest earned. (Round your answers to 2 decimal places.) h. Working capital. i. Current ratio. (Round your answers to 2 decimal places.) j. Quick (acid-test) ratio. (Round your answers to 2 decimal places.) k. Accounts receivable turnover. (Round your answers to 2 decimal places.) l. Inventory turnover. (Round your answers to 2 decimal places.) m. Debt-to-equity ratio. (Round your answers to 2 decimal places.) n. Debt-to-assets ratio. (Round your answers to the nearest whole percent.)
PLEASE READ: THIS IS ONE QUESTION. Please assist me with the INCORRECT ANSWERS ONLY. Thank you.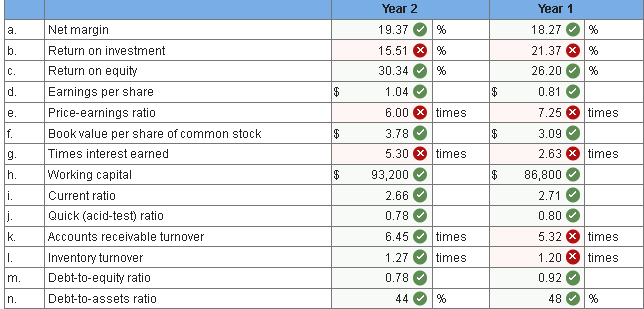
Step by Step Solution
There are 3 Steps involved in it
Step: 1

Get Instant Access to Expert-Tailored Solutions
See step-by-step solutions with expert insights and AI powered tools for academic success
Step: 2

Step: 3
Ace Your Homework with AI
Get the answers you need in no time with our AI-driven, step-by-step assistance
Get Started
Accounting
Authors: Carl s. warren, James m. reeve, Philip e. fess
21st Edition
978-0324400205, 324225016, 324188005, 324400209, 9780324225013, 978-0324188004