

Question
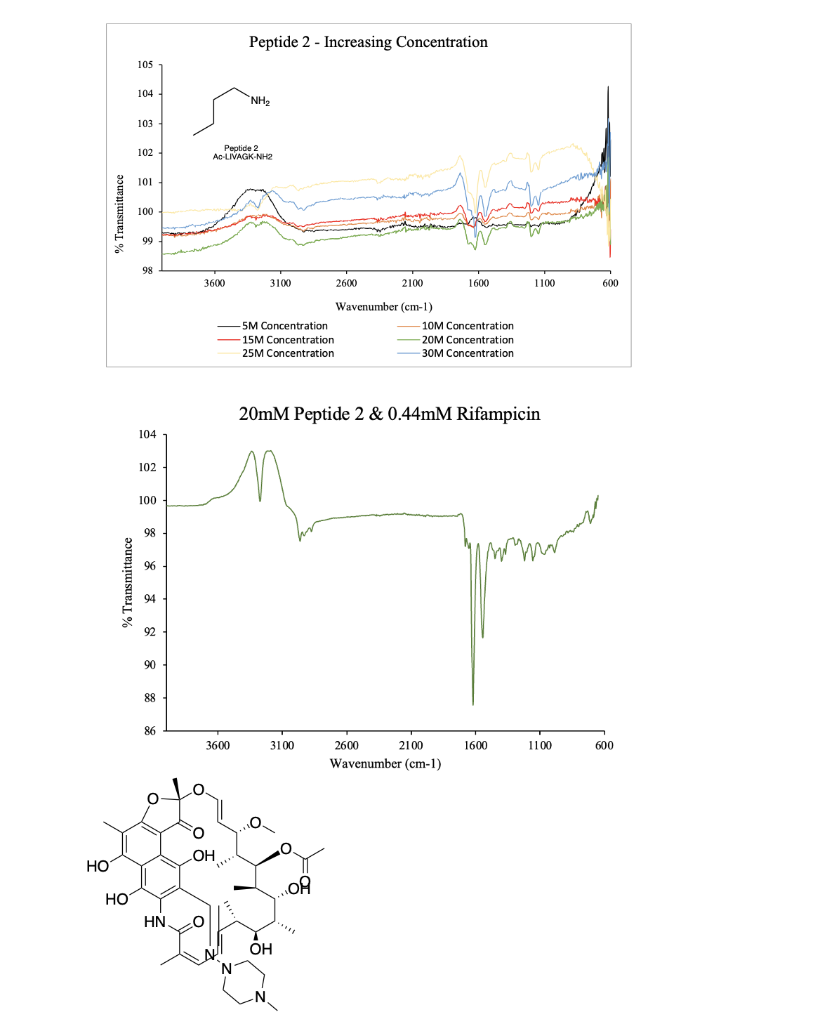
The following first graph shows peptide hydrogels with lysine amino group at different concentrations. Then, the second graph shows the interaction of 20mM hydrogel peptide
The following first graph shows peptide hydrogels with lysine amino group at different concentrations. Then, the second graph shows the interaction of 20mM hydrogel peptide with rifampicin. The structure of peptide is on the first graph and of rifampicin, at the end. Analyse both spectras, and explain what you can tell from the interaction.
Step by Step Solution
There are 3 Steps involved in it
Step: 1

Get Instant Access to Expert-Tailored Solutions
See step-by-step solutions with expert insights and AI powered tools for academic success
Step: 2

Step: 3
Ace Your Homework with AI
Get the answers you need in no time with our AI-driven, step-by-step assistance
Get Started
Chemistry A Molecular Approach
Authors: Nivaldo J. Tro
4th edition
134112830, 978-0134112831