

Answered step by step
Verified Expert Solution
Question
1 Approved Answer
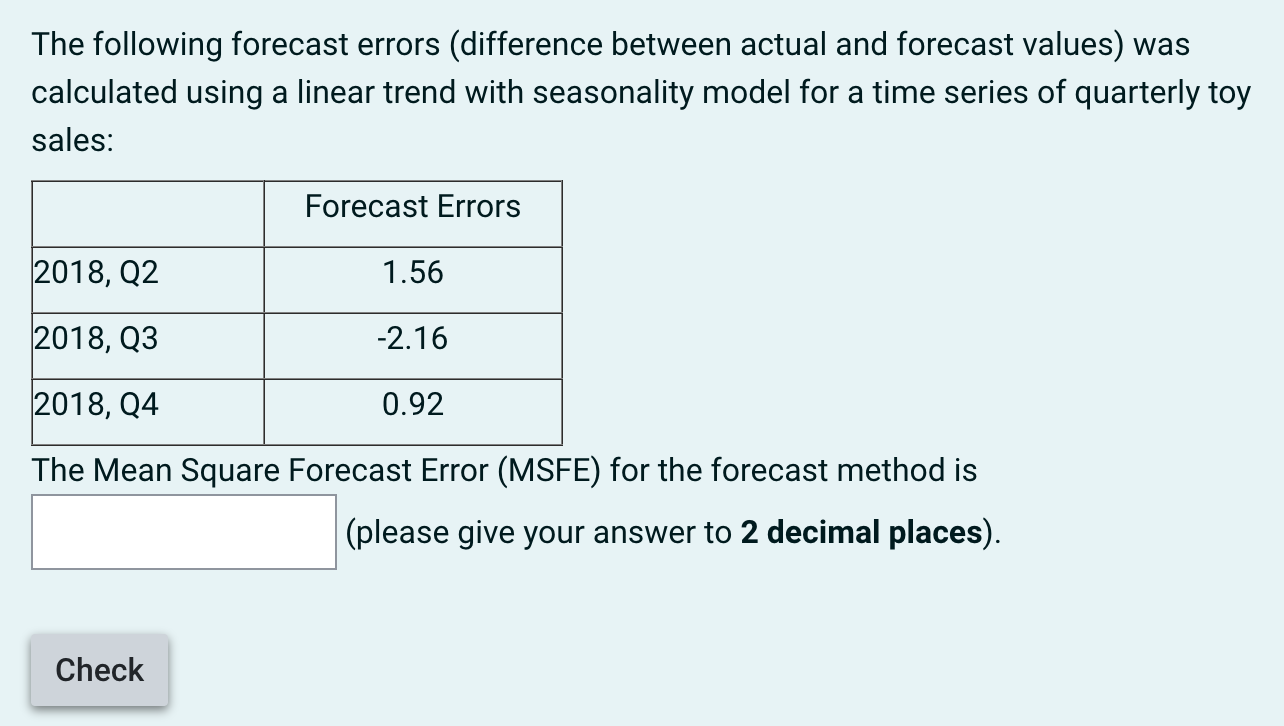
The following forecast errors (difference between actual and forecast values) was calculated using a linear trend with seasonality model for a time series of quarterly


Step by Step Solution
There are 3 Steps involved in it
Step: 1

Get Instant Access to Expert-Tailored Solutions
See step-by-step solutions with expert insights and AI powered tools for academic success
Step: 2

Step: 3
Ace Your Homework with AI
Get the answers you need in no time with our AI-driven, step-by-step assistance
Get Started
Algebra And Number Theory An Integrated Approach
Authors: Martyn R Dixon, Leonid A Kurdachenko, Igor Ya Subbotin
1st Edition
0470640537, 9780470640531