Answered step by step
Verified Expert Solution
Question
1 Approved Answer
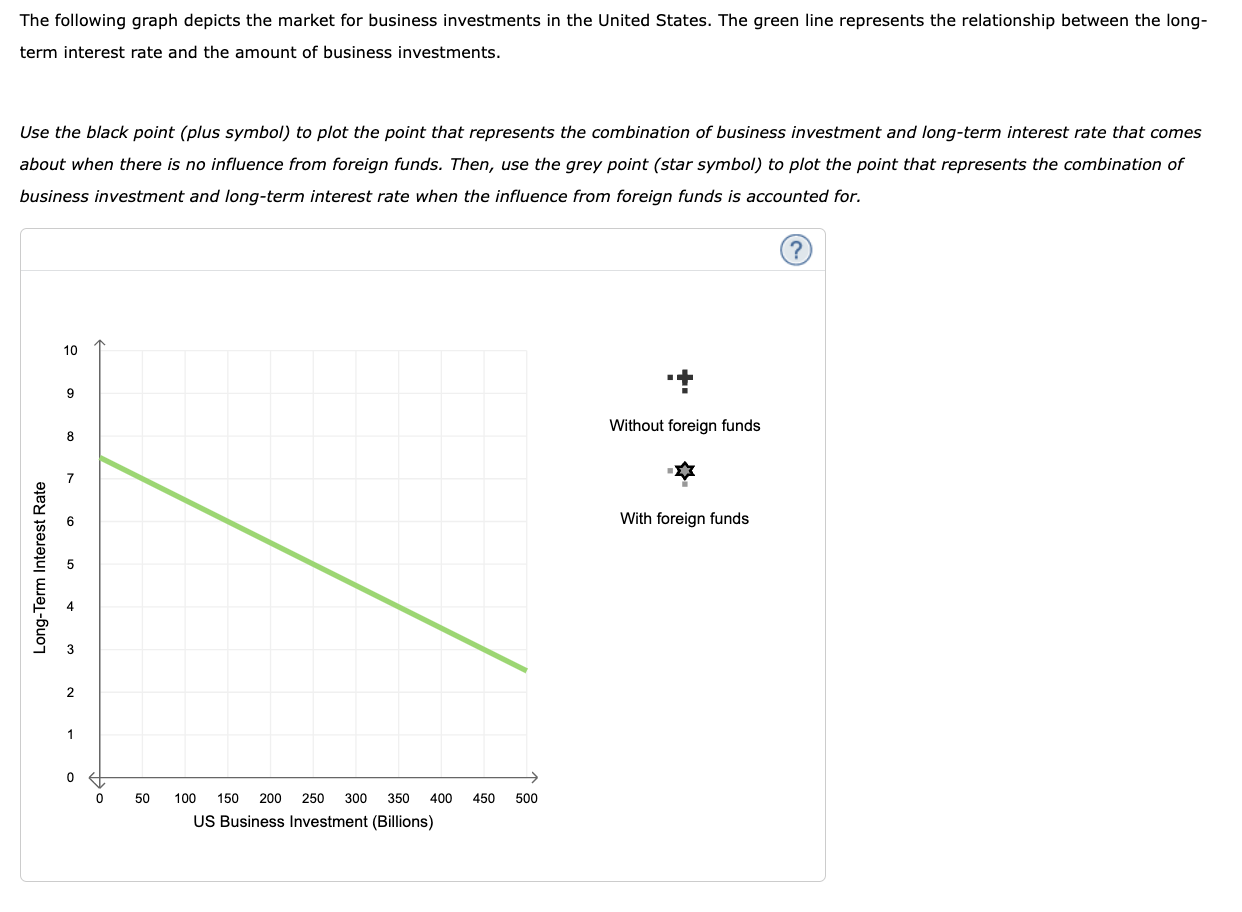
The following graph depicts the market for business investments in the United States. The green line represents the relationship between the long- term interest

The following graph depicts the market for business investments in the United States. The green line represents the relationship between the long- term interest rate and the amount of business investments. Use the black point (plus symbol) to plot the point that represents the combination of business investment and long-term interest rate that comes about when there is no influence from foreign funds. Then, use the grey point (star symbol) to plot the point that represents the combination of business investment and long-term interest rate when the influence from foreign funds is accounted for. Long-Term Interest Rate 10 9 8 6 1 0 0 50 100 150 200 250 300 350 400 450 500 US Business Investment (Billions) + Without foreign funds With foreign funds
Step by Step Solution
There are 3 Steps involved in it
Step: 1
depicts the market for business investments in the United States The green line shows the relationship between the longterm interest rate and the amount of business investments Without foreign funds T...
Get Instant Access to Expert-Tailored Solutions
See step-by-step solutions with expert insights and AI powered tools for academic success
Step: 2

Step: 3

Ace Your Homework with AI
Get the answers you need in no time with our AI-driven, step-by-step assistance
Get Started


