Answered step by step
Verified Expert Solution
Link Copied!

Question

1 Approved Answer

The following graph depicts the various cost curves for a representative competitive firm producing quantity Q1: of $ Costs LRAC MC SRAC P1 Q1 Quantity
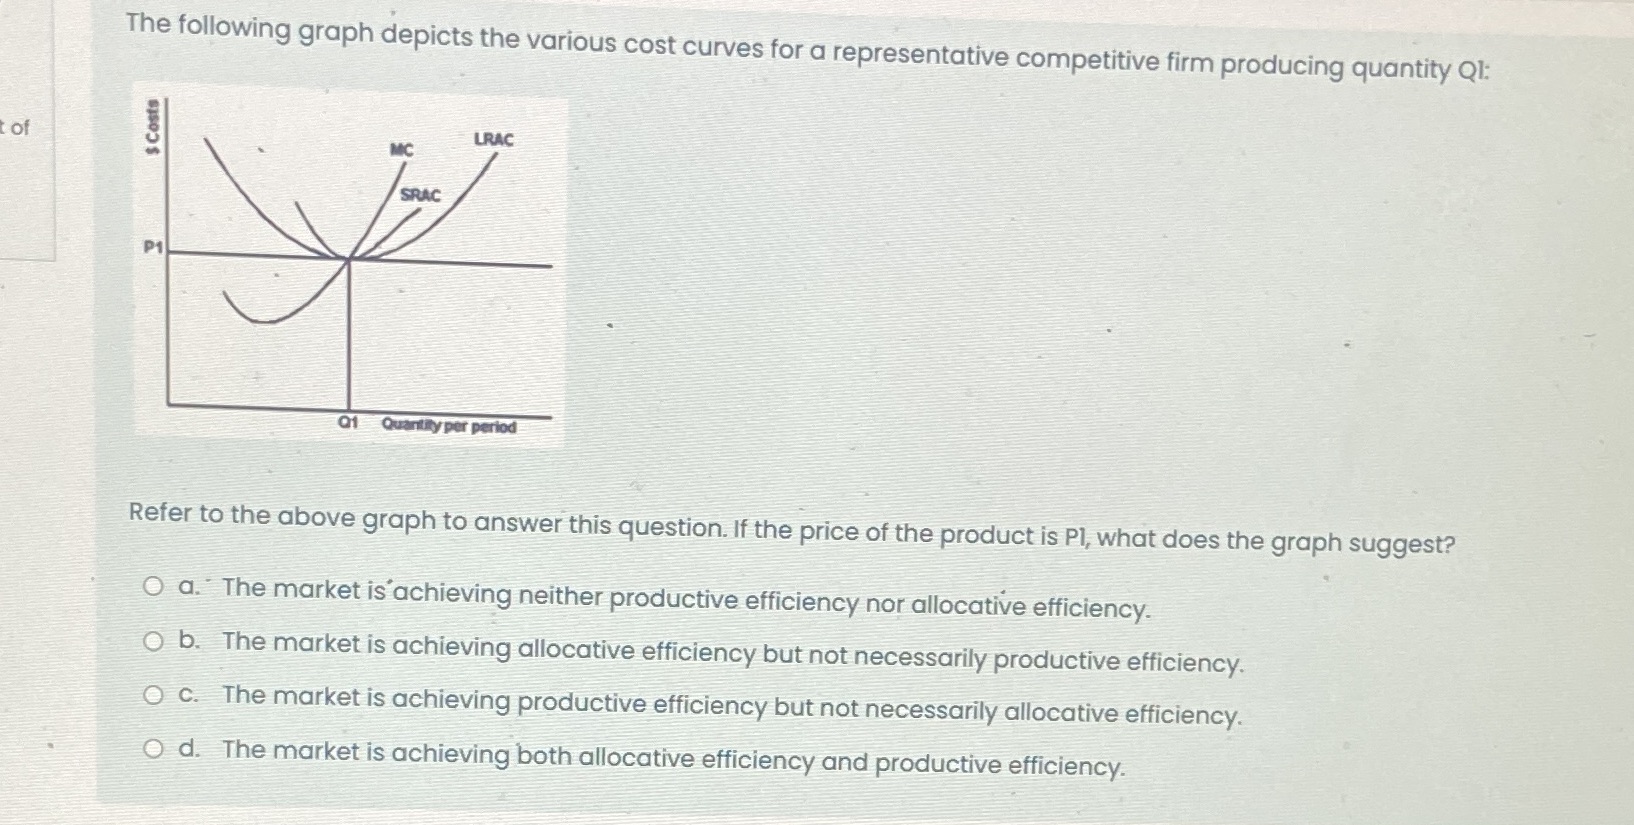
image text in transcribed
The following graph depicts the various cost curves for a representative competitive firm producing quantity Q1: of $ Costs LRAC MC SRAC P1 Q1 Quantity per period Refer to the above graph to answer this question. If the price of the product is Pl, what does the graph suggest? O a. The market is achieving neither productive efficiency nor allocation efficiency. O b. The market is achieving allocation efficiency but not necessarily productive efficiency. O c. The market is achieving productive efficiency but not necessarily allocation efficiency. O d. The market is achieving both allocation efficiency and productive efficiency

Step by Step Solution

There are 3 Steps involved in it

Step: 1

blur-text-image

Get Instant Access to Expert-Tailored Solutions

See step-by-step solutions with expert insights and AI powered tools for academic success

Step: 2

blur-text-image

Step: 3

blur-text-image

Ace Your Homework with AI

Get the answers you need in no time with our AI-driven, step-by-step assistance

Get Started

Recommended Textbook for

Managerial Economics and Business Strategy

Authors: Michael R. baye

7th Edition

978-0073375960, 71267441, 73375969, 978-0071267441

More Books

Students also viewed these Economics questions