

Answered step by step
Verified Expert Solution
Question
1 Approved Answer
The following graph has plots of the net PW of an investment as functions of %-ge changes in the values of the input variables
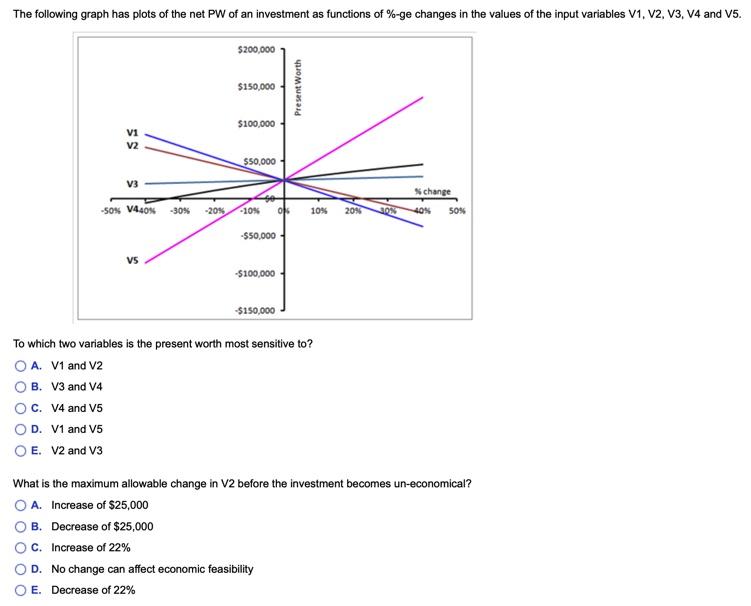
The following graph has plots of the net PW of an investment as functions of %-ge changes in the values of the input variables V1, V2, V3, V4 and V5. V1 V2 V3 504 V 01 V5 -30% -20% B. Decrease of $25,000 C. Increase of 22% $200,000 $150,000 $100,000 $50,000 -10% 0 -$50,000 - -$100,000 -$150,000 Present Worth To which two variables is the present worth most sensitive to? A. V1 and V2 B. V3 and V4 C. V4 and V5 O D. V1 and V5 O E. V2 and V3 10% 20% D. No change can affect economic feasibility E. Decrease of 22% What is the maximum allowable change in V2 before the investment becomes un-economical? OA. Increase of $25,000 % change 30% 40% 50%
Step by Step Solution
There are 3 Steps involved in it
Step: 1
Which two variables is the present worth most sensitive to Answer D V1 and V5 This can be seen from ...
Get Instant Access to Expert-Tailored Solutions
See step-by-step solutions with expert insights and AI powered tools for academic success
Step: 2

Step: 3
Ace Your Homework with AI
Get the answers you need in no time with our AI-driven, step-by-step assistance
Get Started
An Introduction To Statistical Methods And Data Analysis
Authors: R. Lyman Ott, Micheal T. Longnecker
7th Edition
1305269470, 978-1305465527, 1305465520, 978-1305269477