

Answered step by step
Verified Expert Solution
Question
1 Approved Answer
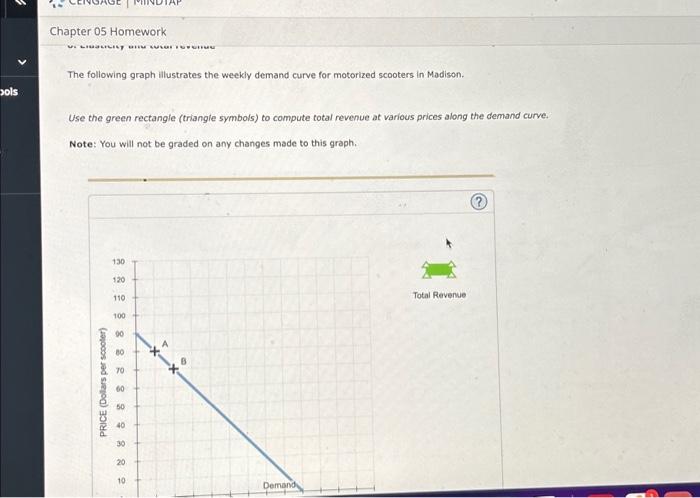
The following graph illustrates the weekly demand curve for motorized scooters in Madison. Use the green rectangle (triangle symbols) to compute total revenue at various
The following graph illustrates the weekly demand curve for motorized scooters in Madison. Use the green rectangle (triangle symbols) to compute total revenue at various prices along the demand curve. Note: You will not be graded on any changes made to this graph. PRICE (Dollars per scooter) 130 120 110 100 90 80 70 60 50 40 30 20 10 A + B + Demand Total Revenue
Step by Step Solution
There are 3 Steps involved in it
Step: 1

Get Instant Access to Expert-Tailored Solutions
See step-by-step solutions with expert insights and AI powered tools for academic success
Step: 2

Step: 3
Ace Your Homework with AI
Get the answers you need in no time with our AI-driven, step-by-step assistance
Get Started
Basic Finance An Introduction to Financial Institutions Investments and Management
Authors: Herbert B. Mayo
10th edition
1111820635, 978-1111820633