

Answered step by step
Verified Expert Solution
Question
1 Approved Answer
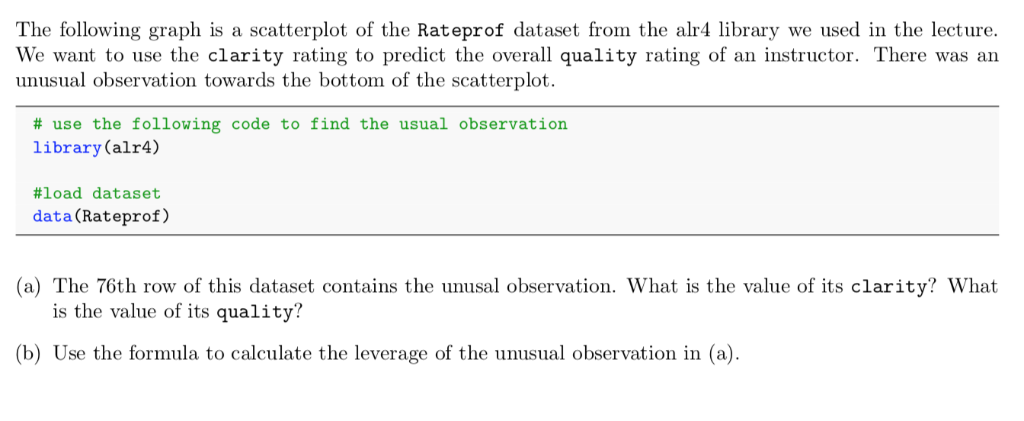
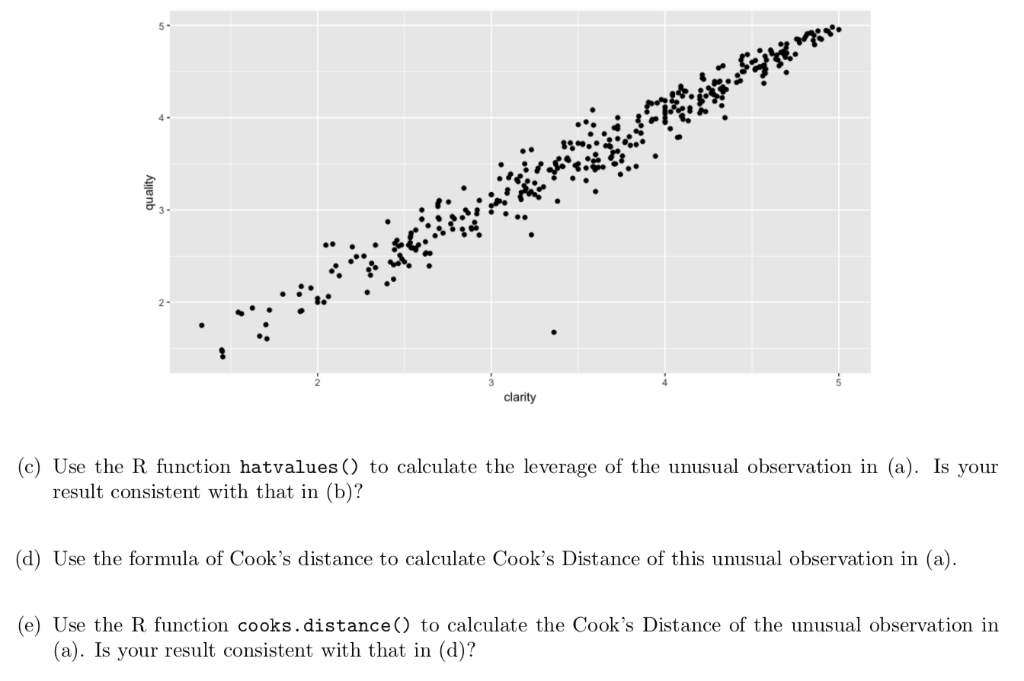
The following graph is a scatterplot of the Rateprof dataset from the alr4 library we used in the lecture. We want to use the clarity
Step by Step Solution
There are 3 Steps involved in it
Step: 1

Get Instant Access to Expert-Tailored Solutions
See step-by-step solutions with expert insights and AI powered tools for academic success
Step: 2

Step: 3
Ace Your Homework with AI
Get the answers you need in no time with our AI-driven, step-by-step assistance
Get Started
Concepts Of Database Management
Authors: Joy L. Starks, Philip J. Pratt, Mary Z. Last
9th Edition
1337093424, 978-1337093422