Question
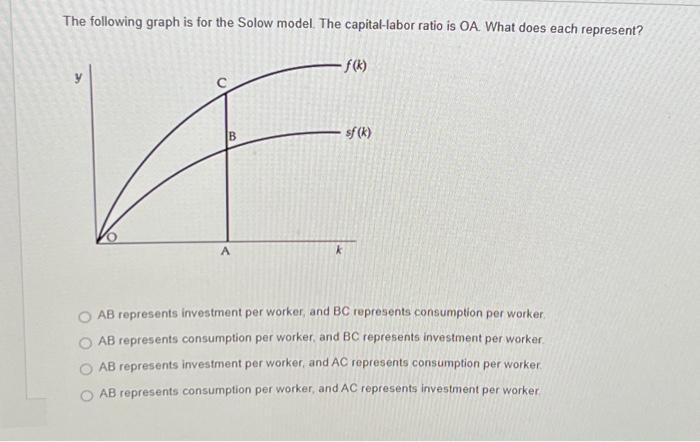
The following graph is for the Solow model. The capital-labor ratio is OA. What does each represent? -f(k) B E A sf (k) OAB

The following graph is for the Solow model. The capital-labor ratio is OA. What does each represent? -f(k) B E A sf (k) OAB represents investment per worker, and BC represents consumption per worker AB represents consumption per worker, and BC represents investment per worker. AB represents investment per worker, and AC represents consumption per worker. AB represents consumption per worker, and AC represents investment per worker.
Step by Step Solution
There are 3 Steps involved in it
Step: 1
The detailed answer for the above question is provided below Solution According to the Solow growth ...
Get Instant Access to Expert-Tailored Solutions
See step-by-step solutions with expert insights and AI powered tools for academic success
Step: 2

Step: 3

Ace Your Homework with AI
Get the answers you need in no time with our AI-driven, step-by-step assistance
Get StartedRecommended Textbook for
Elementary Statistics
Authors: Neil A. Weiss
8th Edition
321691237, 978-0321691231
Students also viewed these Economics questions
Question
Answered: 1 week ago
Question
Answered: 1 week ago
Question
Answered: 1 week ago
Question
Answered: 1 week ago
Question
Answered: 1 week ago
Question
Answered: 1 week ago
Question
Answered: 1 week ago
Question
Answered: 1 week ago
Question
Answered: 1 week ago
Question
Answered: 1 week ago
Question
Answered: 1 week ago
Question
Answered: 1 week ago
Question
Answered: 1 week ago
Question
Answered: 1 week ago
Question
Answered: 1 week ago
Question
Answered: 1 week ago
Question
Answered: 1 week ago
Question
Answered: 1 week ago
Question
Answered: 1 week ago
Question
Answered: 1 week ago
View Answer in SolutionInn App


