

Answered step by step
Verified Expert Solution
Question
1 Approved Answer
The following graph plots a supply curve (orange line) for several sellers in the market for motor scooters in State College, a university town in
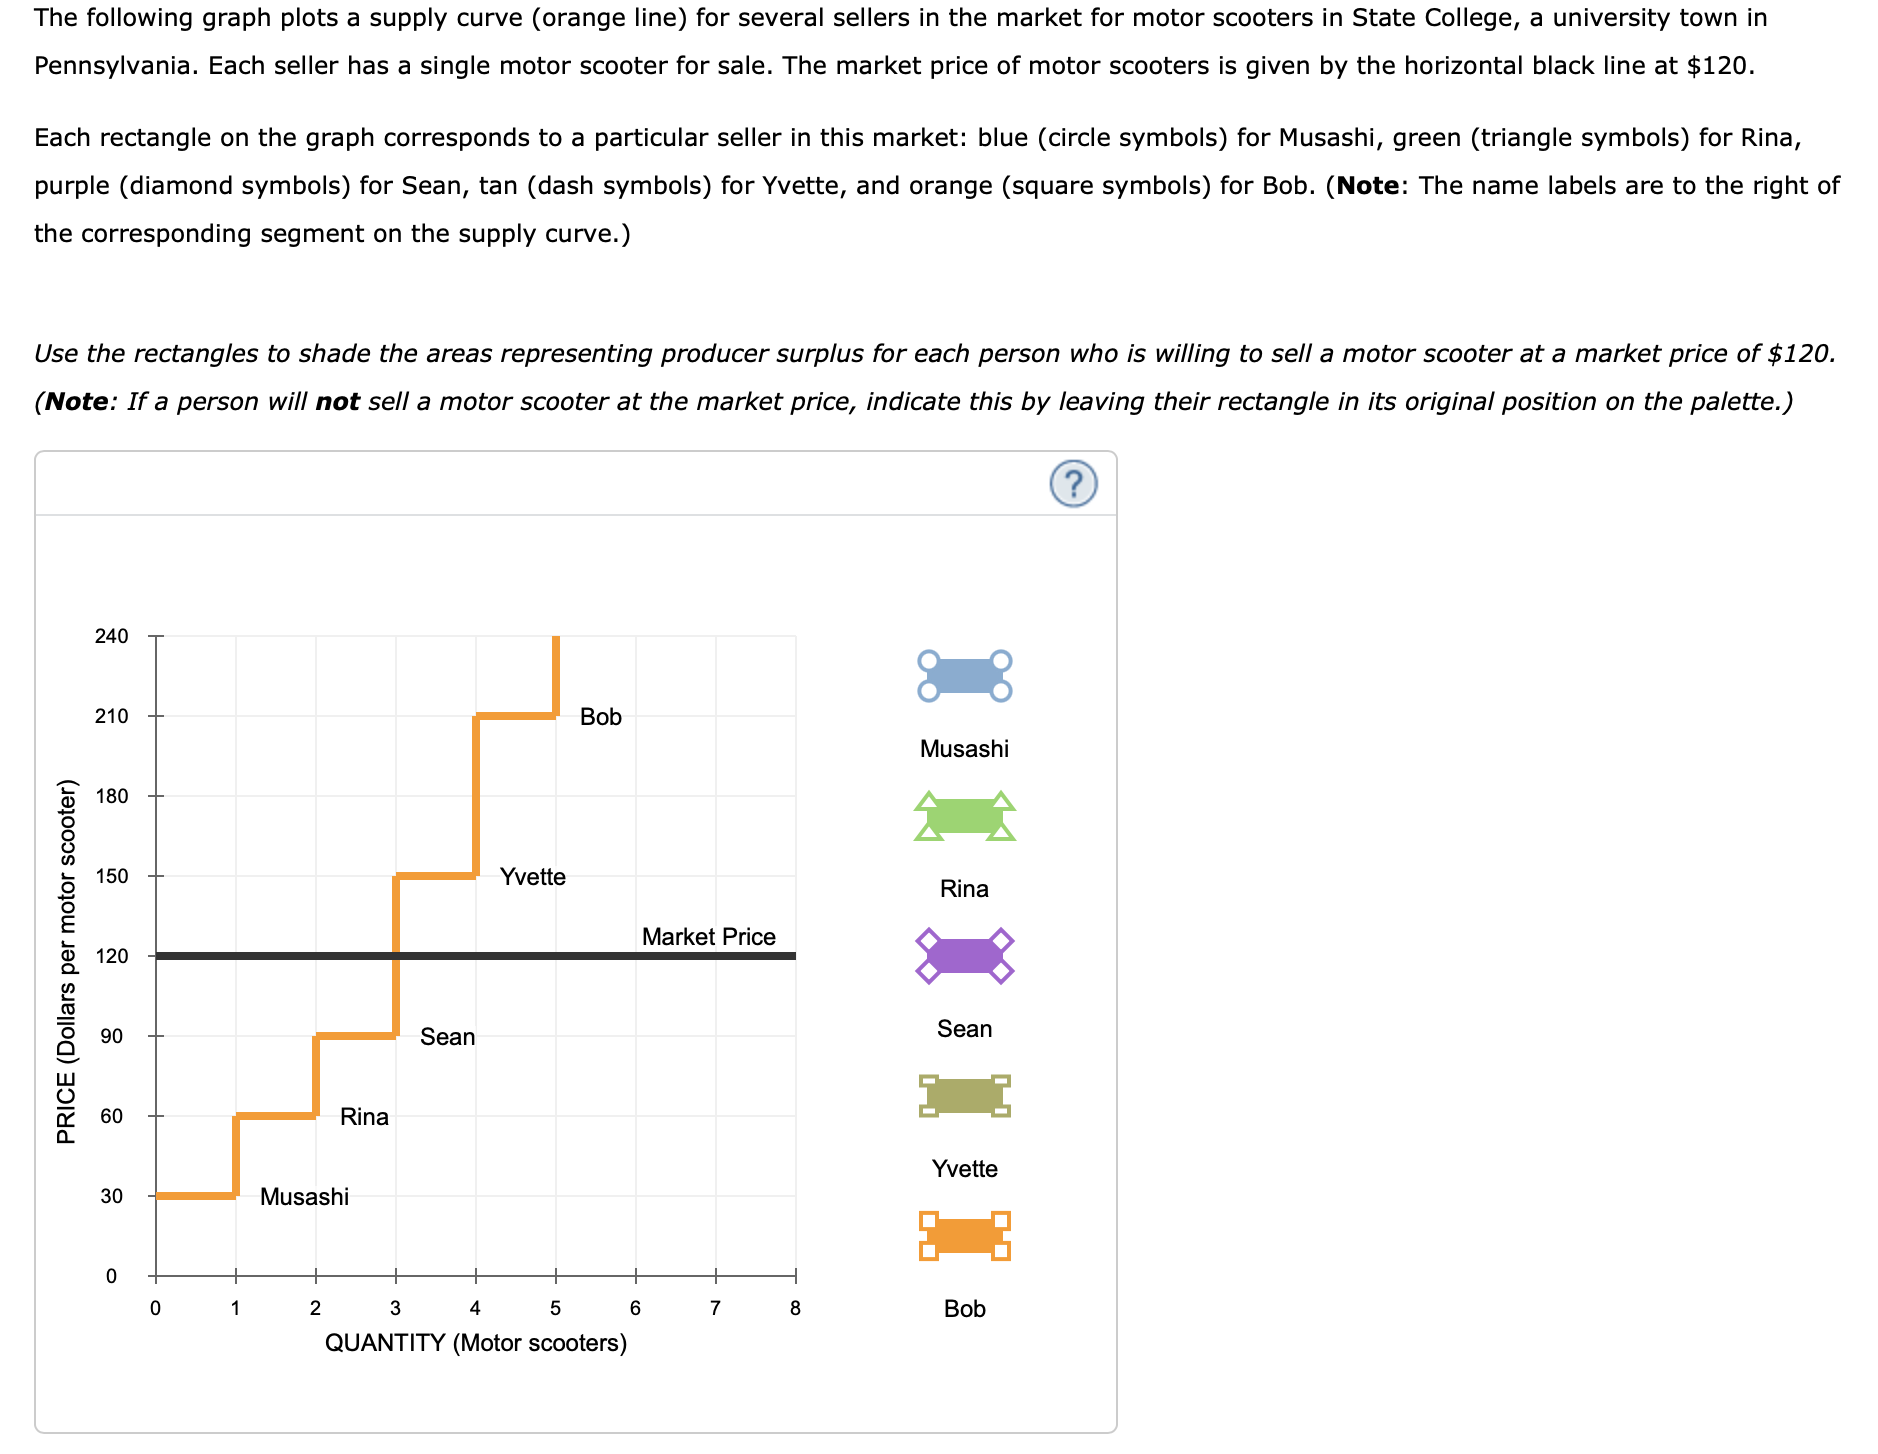
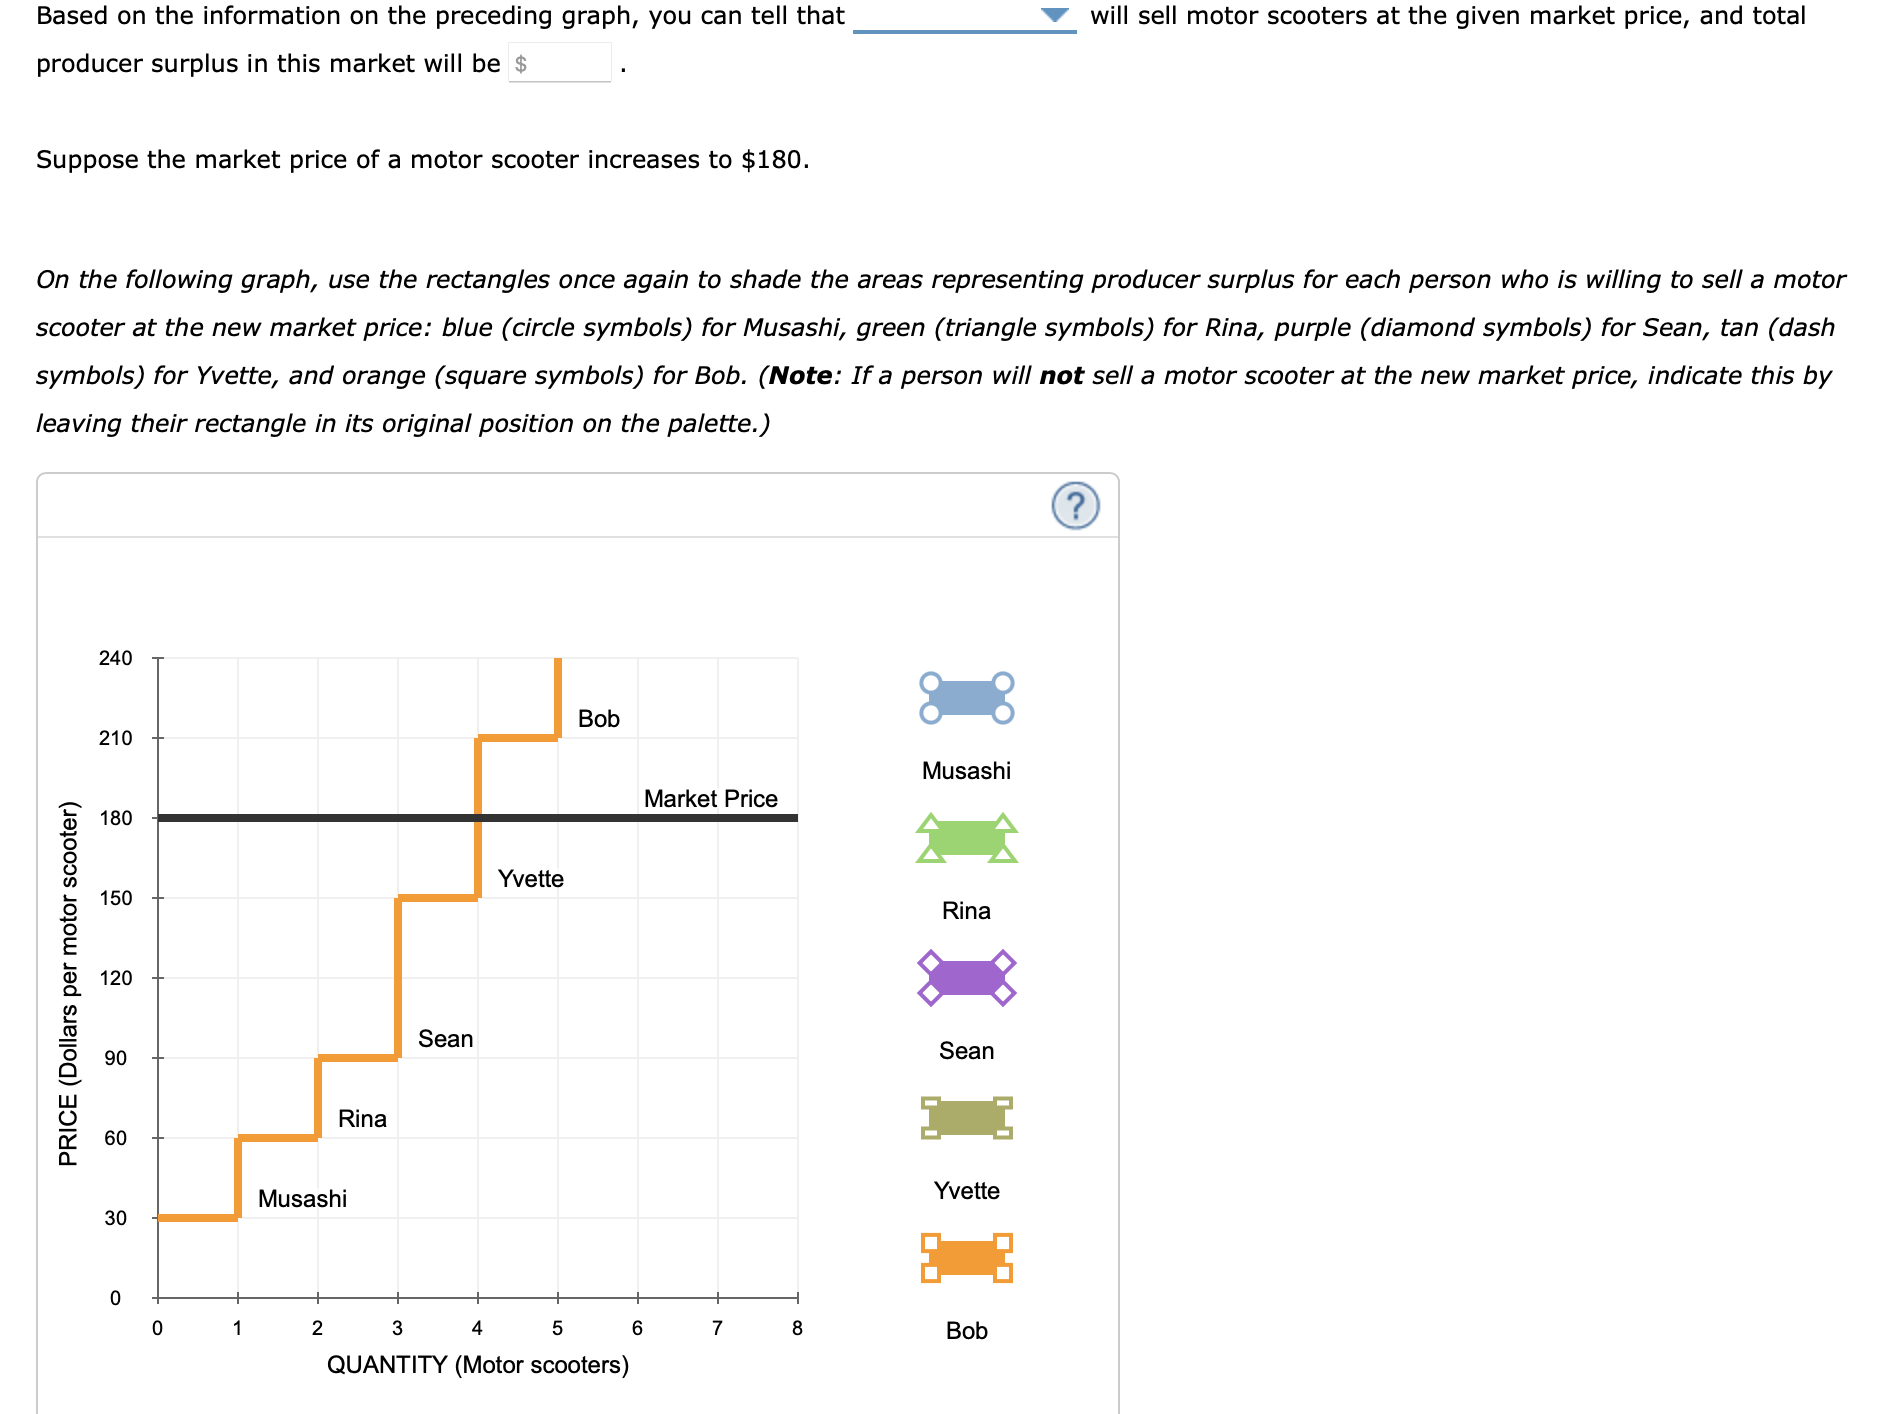
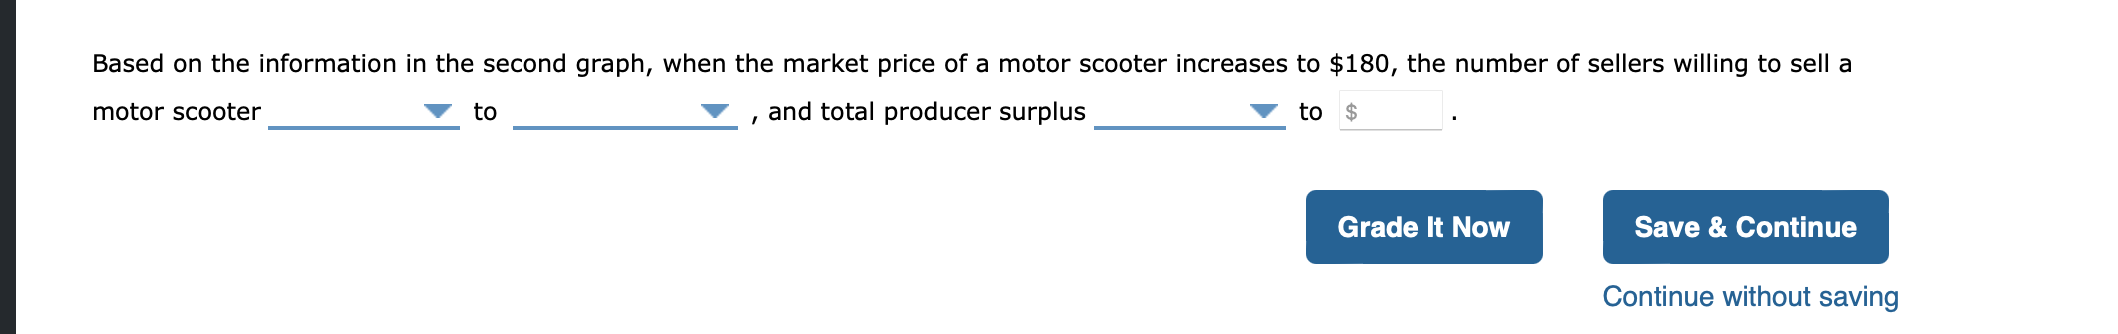 The following graph plots a supply curve (orange line) for several sellers in the market for motor scooters in State College, a university town in Pennsylvania. Each seller has a single motor scooter for sale. The market price of motor scooters is given by the horizontal black line at $120. Each rectangle on the graph corresponds to a particular seller in this market: blue (circle symbols) for Musashi, green (triangle symbols) for Rina, purple (diamond symbols) for Sean, tan (dash symbols) for Yvette, and orange (square symbols) for Bob. (Note: The name labels are to the right of the corresponding segment on the supply curve.) Use the rectangles to shade the areas representing producer surplus for each person who is willing to sell a motor scooter at a market price of $120. (Note: If a person will not sell a motor scooter at the market price, indicate this by leaving their rectangle in its original position on the palette.) Based on the information on the preceding graph, you can tell that will sell motor scooters at the given market price, and total producer surplus in this market will be Suppose the market price of a motor scooter increases to $180. On the following graph, use the rectangles once again to shade the areas representing producer surplus for each person who is willing to sell a motor scooter at the new market price: blue (circle symbols) for Musashi, green (triangle symbols) for Rina, purple (diamond symbols) for Sean, tan (dash symbols) for Yvette, and orange (square symbols) for Bob. (Note: If a person will not sell a motor scooter at the new market price, indicate this by leaving their rectangle in its original position on the palette.) Based on the information in the second graph, when the market price of a motor scooter increases to $180, the number of sellers willing to sell a motor scooter to , and total producer surplus to The following graph plots a supply curve (orange line) for several sellers in the market for motor scooters in State College, a university town in Pennsylvania. Each seller has a single motor scooter for sale. The market price of motor scooters is given by the horizontal black line at $120. Each rectangle on the graph corresponds to a particular seller in this market: blue (circle symbols) for Musashi, green (triangle symbols) for Rina, purple (diamond symbols) for Sean, tan (dash symbols) for Yvette, and orange (square symbols) for Bob. (Note: The name labels are to the right of the corresponding segment on the supply curve.) Use the rectangles to shade the areas representing producer surplus for each person who is willing to sell a motor scooter at a market price of $120. (Note: If a person will not sell a motor scooter at the market price, indicate this by leaving their rectangle in its original position on the palette.) Based on the information on the preceding graph, you can tell that will sell motor scooters at the given market price, and total producer surplus in this market will be Suppose the market price of a motor scooter increases to $180. On the following graph, use the rectangles once again to shade the areas representing producer surplus for each person who is willing to sell a motor scooter at the new market price: blue (circle symbols) for Musashi, green (triangle symbols) for Rina, purple (diamond symbols) for Sean, tan (dash symbols) for Yvette, and orange (square symbols) for Bob. (Note: If a person will not sell a motor scooter at the new market price, indicate this by leaving their rectangle in its original position on the palette.) Based on the information in the second graph, when the market price of a motor scooter increases to $180, the number of sellers willing to sell a motor scooter to , and total producer surplus to
 Step by Step Solution
There are 3 Steps involved in it
Step: 1

Get Instant Access to Expert-Tailored Solutions
See step-by-step solutions with expert insights and AI powered tools for academic success
Step: 2

Step: 3
Ace Your Homework with AI
Get the answers you need in no time with our AI-driven, step-by-step assistance
Get Started
Audit Methodology To Bring Added Value To The Company How Can Internal Auditors Add Value To The Company
Authors: Georges HATHRY
1st Edition
6205447940, 978-6205447949