Answered step by step
Verified Expert Solution
Question
1 Approved Answer
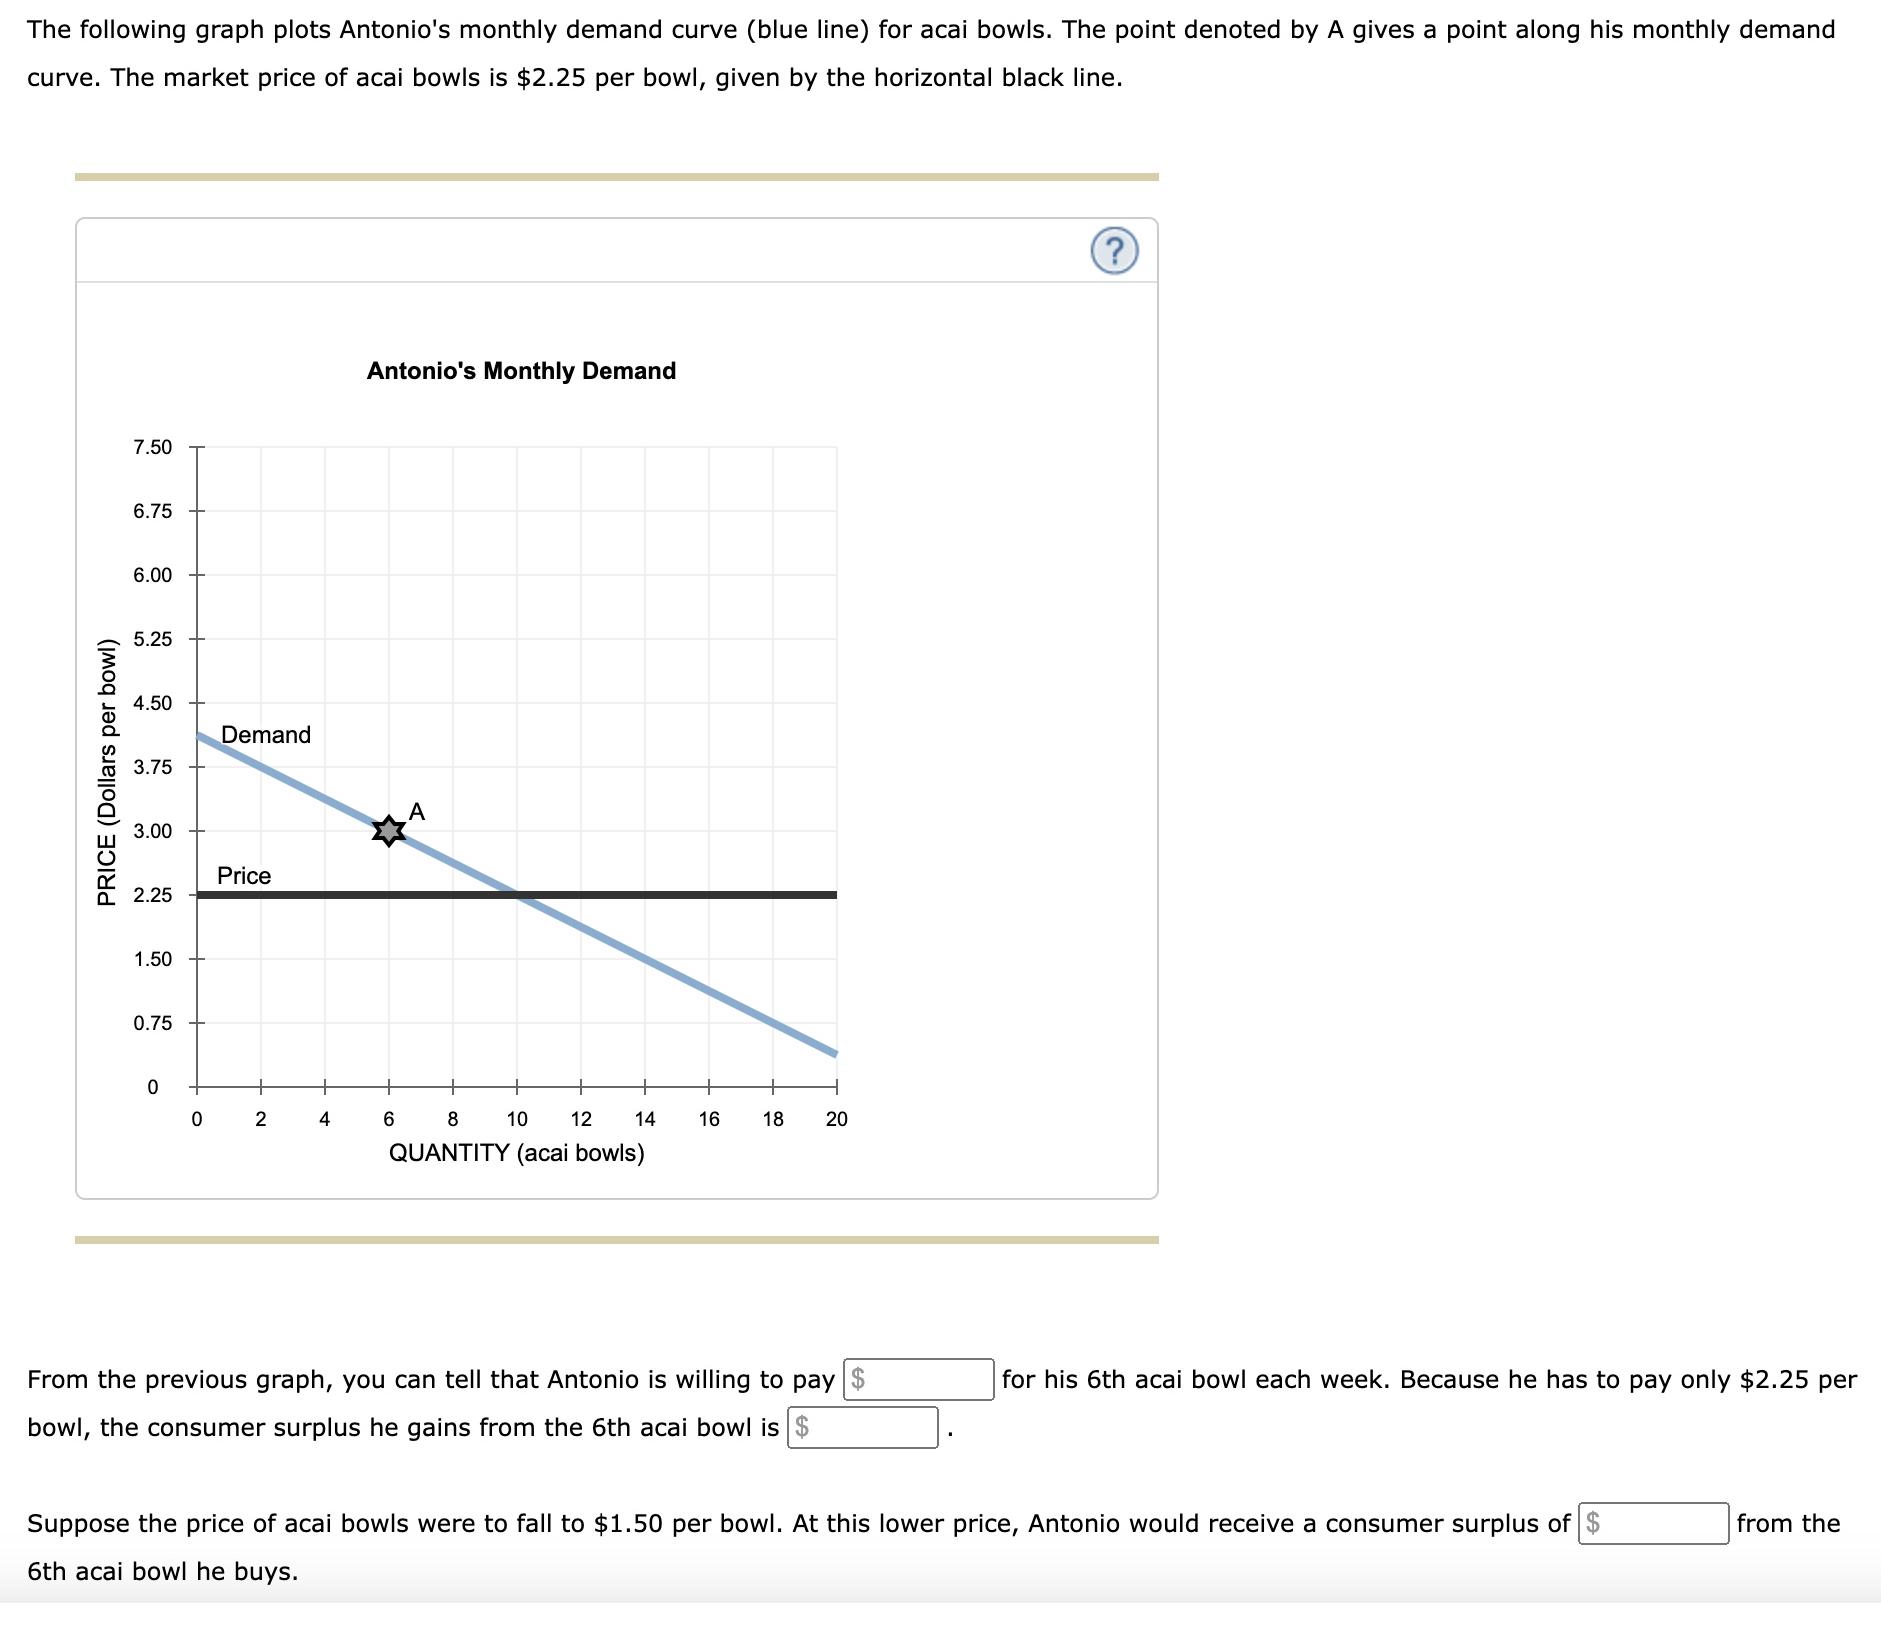
The following graph plots Antonio's monthly demand curve (blue line) for acai bowls. The point denoted by A gives a point along his monthly


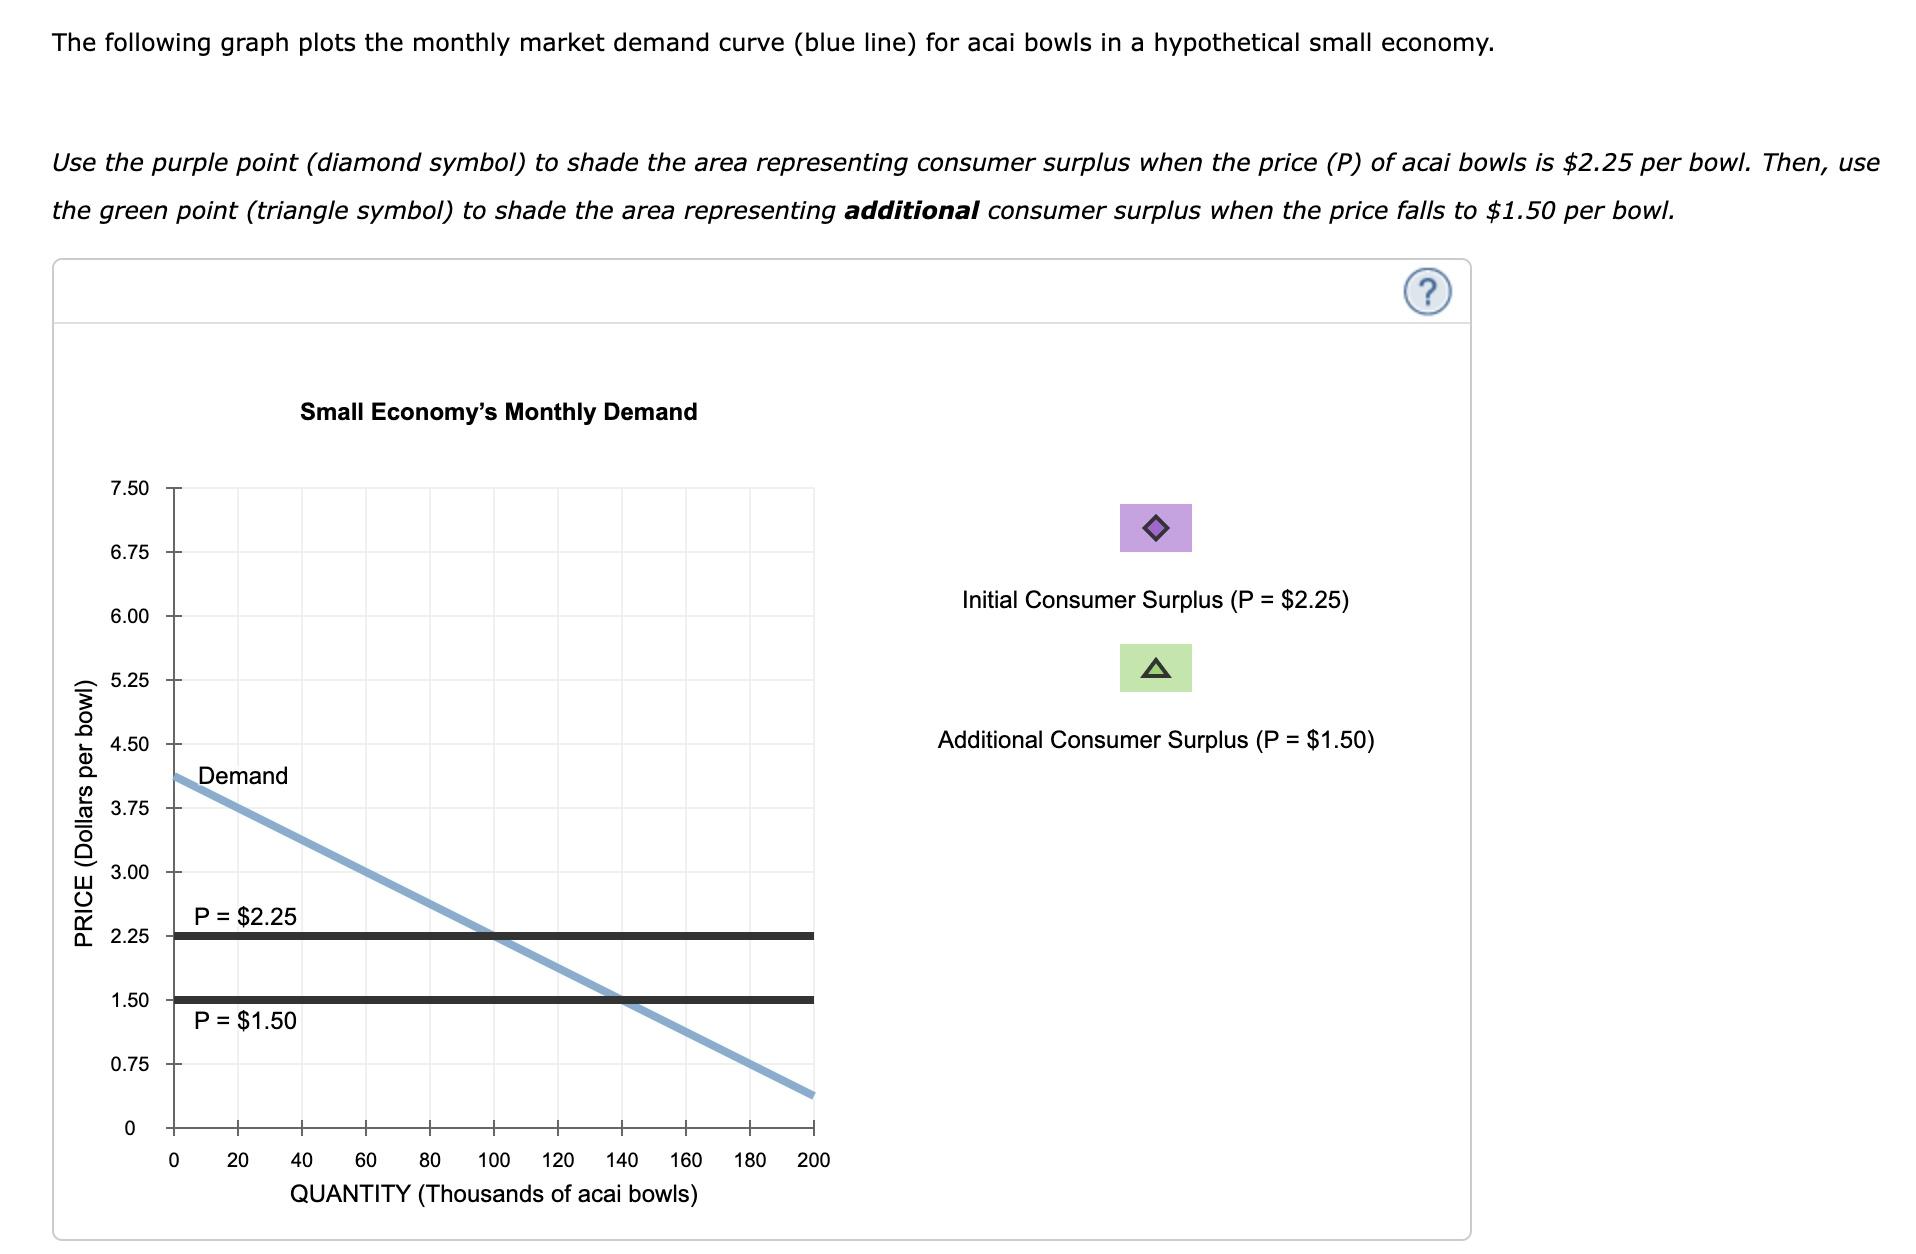
The following graph plots Antonio's monthly demand curve (blue line) for acai bowls. The point denoted by A gives a point along his monthly demand curve. The market price of acai bowls is $2.25 per bowl, given by the horizontal black line. PRICE (Dollars per bowl) 7.50 6.75 6.00 5.25 4.50 3.75 3.00 2.25 1.50 0.75 0 0 Demand Price 2 + 4 Antonio's Monthly Demand A 6 8 10 12 14 QUANTITY (acai bowls) 16 18 20 From the previous graph, you can tell that Antonio is willing to pay $ bowl, the consumer surplus he gains from the 6th acai bowl is $ ? for his 6th acai bowl each week. Because he has to pay only $2.25 per Suppose the price of acai bowls were to fall to $1.50 per bowl. At this lower price, Antonio would receive a consumer surplus of $ 6th acai bowl he buys. from the The following graph plots the monthly market demand curve (blue line) for acai bowls in a hypothetical small economy. Use the purple point (diamond symbol) to shade the area representing consumer surplus when the price (P) of acai bowls is $2.25 per bowl. Then, use the green point (triangle symbol) to shade the area representing additional consumer surplus when the price falls to $1.50 per bowl. ? PRICE (Dollars per bowl) 7.50 6.75 6.00 5.25 4.50 3.75 3.00 2.25 1.50 0.75 0 0 Demand P = $2.25 P = $1.50 20 Small Economy's Monthly Demand 60 80 100 120 140 160 QUANTITY (Thousands of acai bowls) 40 180 200 Initial Consumer Surplus (P = $2.25) Additional Consumer Surplus (P = $1.50)
Step by Step Solution
★★★★★
3.42 Rating (158 Votes )
There are 3 Steps involved in it
Step: 1
The provided images display two graphs regarding demand curves for acai bowls Lets analyze them to answer the questions From the first graph we need t...
Get Instant Access to Expert-Tailored Solutions
See step-by-step solutions with expert insights and AI powered tools for academic success
Step: 2

Step: 3

Ace Your Homework with AI
Get the answers you need in no time with our AI-driven, step-by-step assistance
Get Started


