

Question
The following graph plots portfolio risk against the size of the portfolio as measured by the number of stocks in the portfolio. (Hint: Hover the
The following graph plots portfolio risk against the size of the portfolio as measured by the number of stocks in the portfolio. (Hint: Hover the mouse over the graph to read the coordinates.)
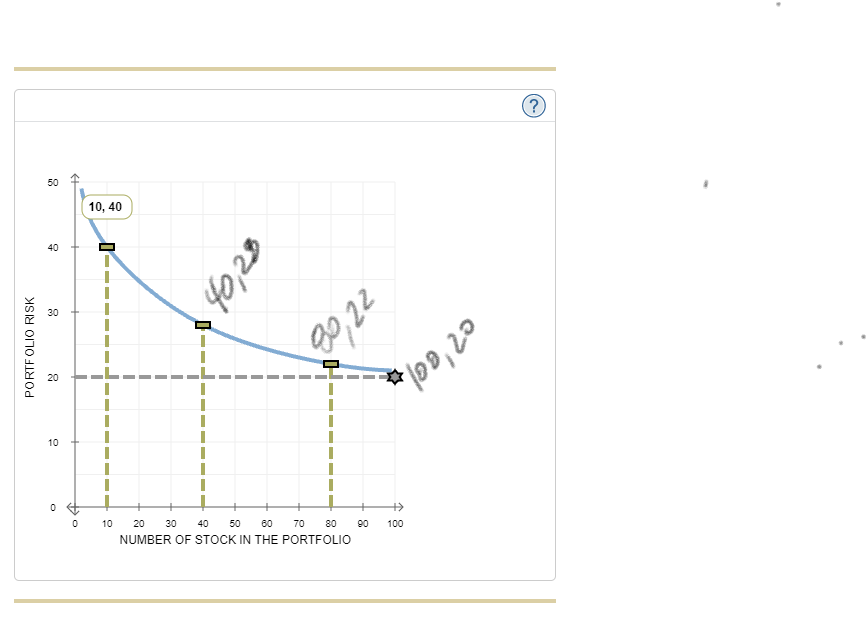
Based on the data presented in the previous graph, which of the following statements are true? Check all that apply.
A portfolio of 80 or more stocks could eliminate almost half of the risk.
A portfolio of 40 stocks has a diversifiable risk of 8%.
The market portfolio would have a standard deviation of 20%.
The market portfolio would have a standard deviation of about 40%.
As the portfolios size increases, its market risk decreases.
The benchmark for a well-diversified stock portfolio is the market portfolio, which is a portfolio containing all stocks. The relevant risk of an individual stock is measured by its beta coefficient, which is defined under the Capital Asset Pricing Model (CAPM) as the amount of risk that the stock contributes to the well-diversified portfolio. Based on your understanding of the CAPM and beta, answer the following question:
Which of the following statements about stocks correlation with the market is true?
A stock with a high correlation with the market is risky.
A stock with low stand-alone risk will tend to destabilize the portfolio.
A stock with a low correlation with the market is risky.
(?) 50 17 10, 40 40 40,2 PORTFOLIO RISK 9922 20 100,20 10 0 0 of +> 100 0 10 20 60 70 80 90 30 40 50 NUMBER OF STOCK IN THE PORTFOLIOStep by Step Solution
There are 3 Steps involved in it
Step: 1

Get Instant Access to Expert-Tailored Solutions
See step-by-step solutions with expert insights and AI powered tools for academic success
Step: 2

Step: 3
Ace Your Homework with AI
Get the answers you need in no time with our AI-driven, step-by-step assistance
Get Started
E Marketing Theory And Application
Authors: Stephen Dann ,Susan Dann
2011 Edition
0230203965, 978-0230203969