

Answered step by step
Verified Expert Solution
Question
1 Approved Answer
The following graph plots the relationship between risk, calculated as the standard deviation of the return of a stock portfolio, and the number of different
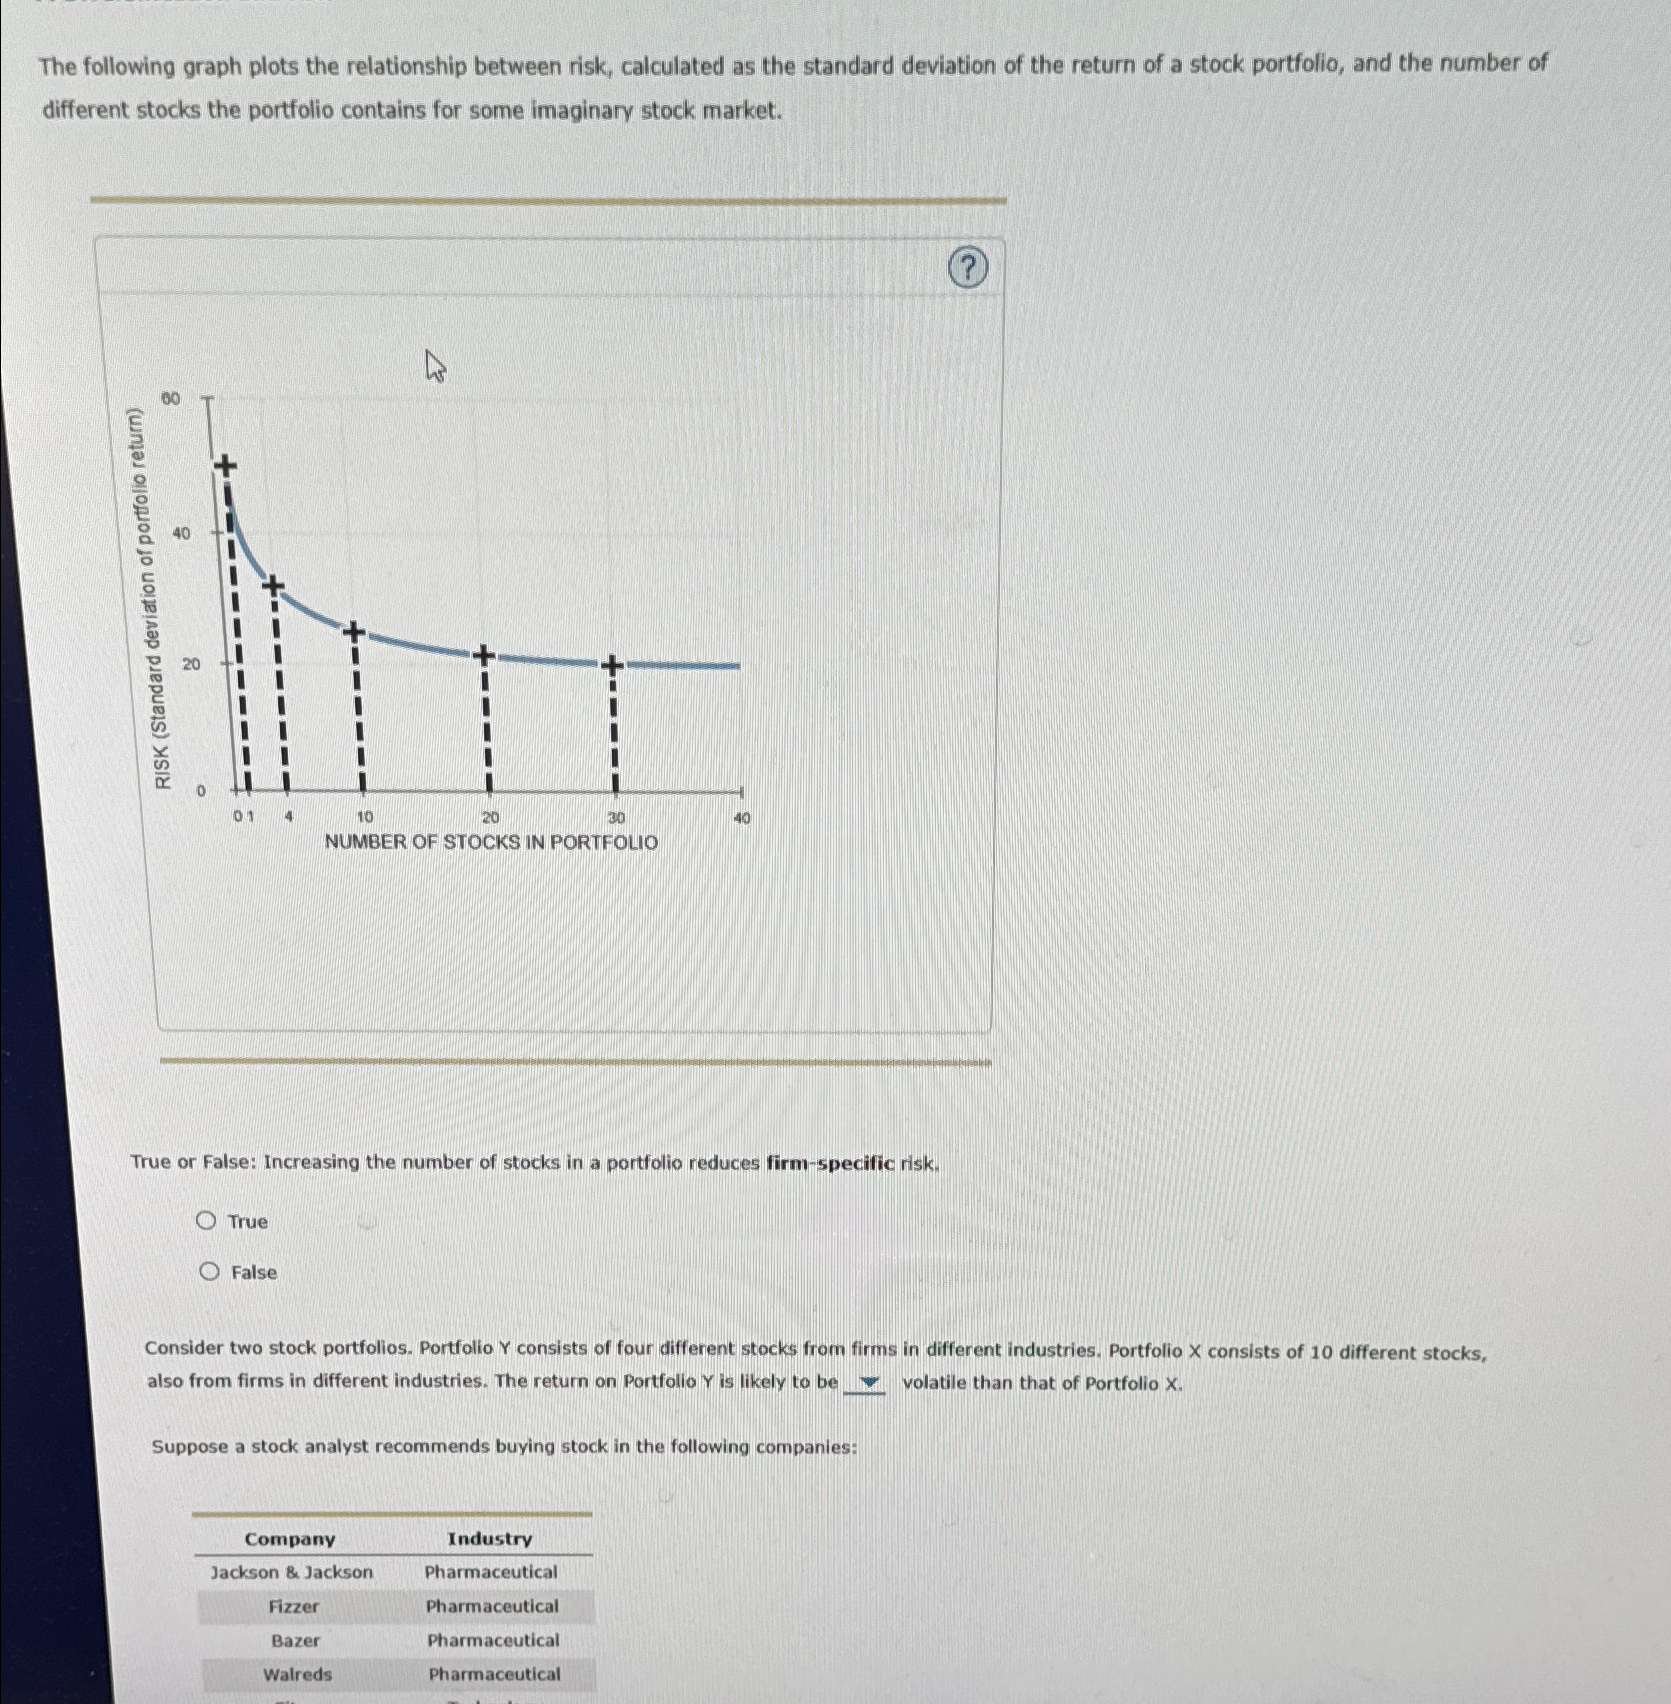
The following graph plots the relationship between risk, calculated as the standard deviation of the return of a stock portfolio, and the number of different stocks the portfolio contains for some imaginary stock market.
True or False: Increasing the number of stocks in a portfolio reduces firmpecific risk.
True
False
Consider two stock portfolios. Portfolio Y consists of four different stocks from firms in different industries. Portfolio X consists of different stocks, also from firms in different industries. The return on Portfolio is likely to be volatile than that of Portfolio
Suppose a stock analyst recommends buying stock in the following companies:
tableCompanyIndustryJackson & Jackson,PharmaceuticalFizzerPharmaceuticalBazerPharmaceuticalWalredsPharmaceuticalCitronTechnologyZahooTechnologyAthenaApparel
True or False: Increasing the number of stocks in a portfolio reduces firmspecific risk.
True
False
Consider two stock portfolios. Portfolio Y consists of four different stocks from firms in different industries. Portfolio X consists of different stocks, also from firms in different industries. The return on Portfolio is likely to be volatile than that of Portfolio
Suppose a stock analyst recommends buying stock in the following companies:
tableCompanyIndustryJackson & Jackson,PharmaceuticalFizzerPharmaceuticalBazerPharmaceuticalWalredsPharmaceuticalCitronTechnologyZahooTechnologyAthenaApparelEdidesApparelGeneric Motors,AutomotiveHorizonTelecommunications
Each of the following portfolios contains stock picks from four of the listed companies. Which of the portfolios is the least diversified?
Jackson & Jackson, Fizzer, Bazer, Walreds
Horizon, Athena, Generic Motors, Citron
Jackson & Jackson, Walreds, Edides, Athena
Edides, Athena, Citron, Zahoo
The following graph plots the relationship between risk, calculated as the standard deviation of the return of a stock portfolio, and the number of different stocks the portfolio contains for some imaginary stock market.
True or False: Increasing the number of stocks in a portfolio reduces firmspecific risk.
True
False
Consider two stock portfolios. Portfolio consists of four different stocks from firms in different industries. Portfolio consists of different stocks, also from firms in different industries. The return on Portfolio is likely to be volatile than that of Portfolio
Suppose a stock analyst recommends buying stock in the following companies:
tableCompanyIndustryJackson & Jackson,PharmaceuticalFizzerPharmaceuticalBazerPharmaceuticalWalredsPharmaceutical
Step by Step Solution
There are 3 Steps involved in it
Step: 1

Get Instant Access to Expert-Tailored Solutions
See step-by-step solutions with expert insights and AI powered tools for academic success
Step: 2

Step: 3
Ace Your Homework with AI
Get the answers you need in no time with our AI-driven, step-by-step assistance
Get Started
Corporate Finance Investment And Advisory Applications
Authors: Jesse McDougall, Patrick Boyle
1st Edition
1530116597, 9781530116591