

Answered step by step
Verified Expert Solution
Question
1 Approved Answer
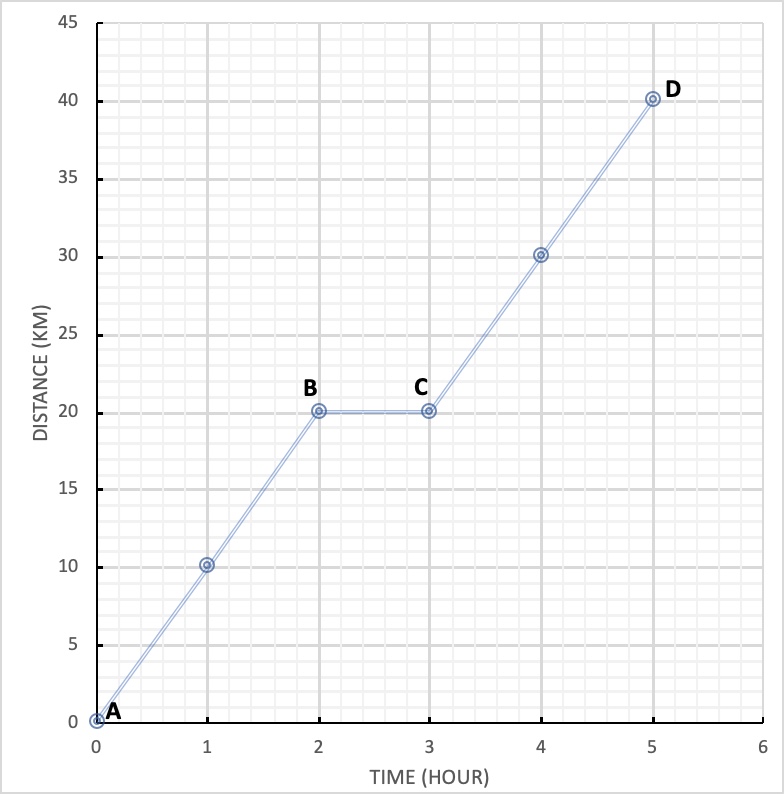
The following graph represents a car's trip from point A to point D. 45 40 OD 35 30 25 DISTANCE (KM) 20 B C 15
The following graph represents a car's trip from point A to point D.
Step by Step Solution
There are 3 Steps involved in it
Step: 1

Get Instant Access to Expert-Tailored Solutions
See step-by-step solutions with expert insights and AI powered tools for academic success
Step: 2

Step: 3
Ace Your Homework with AI
Get the answers you need in no time with our AI-driven, step-by-step assistance
Get Started
Fundamentals of Heat and Mass Transfer
Authors: Incropera, Dewitt, Bergman, Lavine
6th Edition
978-0470055540, 471457280, 470881453, 470055545, 978-0470881453, 978-0471457282