Answered step by step
Verified Expert Solution
Question
1 Approved Answer
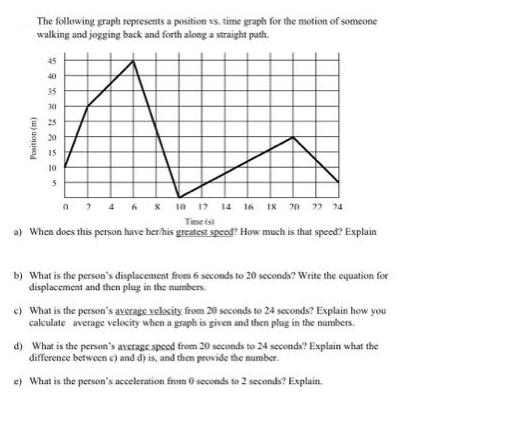
The following graph represents a position vs. time graph for the motion of someone walking and jogging back and forth along a straight path.

The following graph represents a position vs. time graph for the motion of someone walking and jogging back and forth along a straight path. Position (m) 40 35 10 25 20 15 10 5 0 7 4 6 8 10 12 14 16 18 20 22 24 Time(s) a) When does this person have her/his greatest speed? How much is that speed? Explain b) What is the person's displacement from 6 seconds to 20 seconds? Write the equation for displacement and then plug in the numbers. c) What is the person's average velocity from 20 seconds to 24 seconds? Explain how you calculate average velocity when a graph is given and then plug in the numbers. d) What is the person's average speed from 20 seconds to 24 seconds? Explain what the difference between c) and d) is, and then provide the number. e) What is the person's acceleration from 0 seconds to 2 seconds? Explain
Step by Step Solution
★★★★★
3.51 Rating (154 Votes )
There are 3 Steps involved in it
Step: 1
Solution a The point where the person has the greatest speed The point where a speed is at maximum i...
Get Instant Access to Expert-Tailored Solutions
See step-by-step solutions with expert insights and AI powered tools for academic success
Step: 2

Step: 3

Ace Your Homework with AI
Get the answers you need in no time with our AI-driven, step-by-step assistance
Get Started


