Question
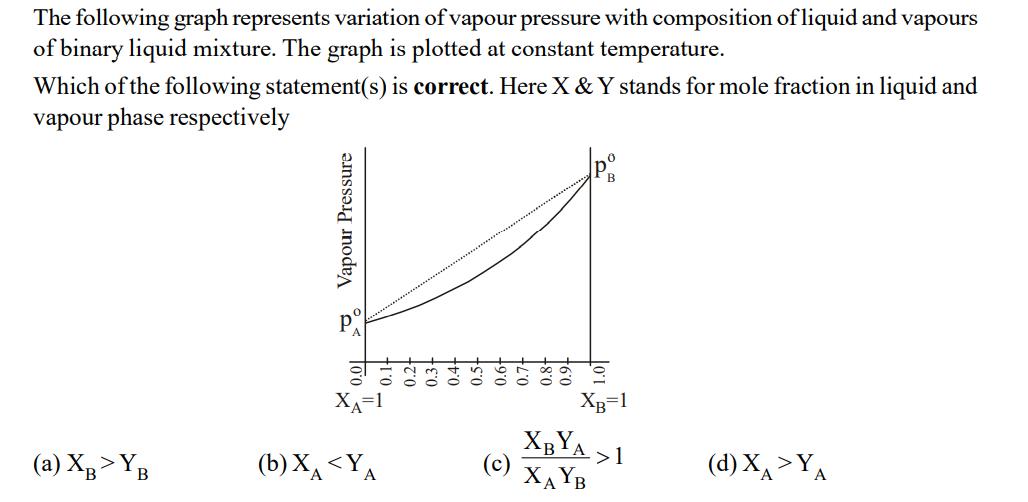
The following graph represents variation of vapour pressure with composition of liquid and vapours of binary liquid mixture. The graph is plotted at constant

The following graph represents variation of vapour pressure with composition of liquid and vapours of binary liquid mixture. The graph is plotted at constant temperature. Which of the following statement(s) is correct. Here X & Y stands for mole fraction in liquid and vapour phase respectively (a) XB>YB Vapour Pressure 100 (b) XA 1 XAYB (d) XA>YA
Step by Step Solution
3.49 Rating (162 Votes )
There are 3 Steps involved in it
Step: 1

Get Instant Access to Expert-Tailored Solutions
See step-by-step solutions with expert insights and AI powered tools for academic success
Step: 2

Step: 3

Ace Your Homework with AI
Get the answers you need in no time with our AI-driven, step-by-step assistance
Get StartedRecommended Textbook for
Physical Chemistry
Authors: Peter Atkins
7th Edition
978-0716735397, 716735393, 978-0716743880
Students also viewed these Chemistry questions
Question
Answered: 1 week ago
Question
Answered: 1 week ago
Question
Answered: 1 week ago
Question
Answered: 1 week ago
Question
Answered: 1 week ago
Question
Answered: 1 week ago
Question
Answered: 1 week ago
Question
Answered: 1 week ago
Question
Answered: 1 week ago
Question
Answered: 1 week ago
Question
Answered: 1 week ago
Question
Answered: 1 week ago
Question
Answered: 1 week ago
Question
Answered: 1 week ago
Question
Answered: 1 week ago
Question
Answered: 1 week ago
Question
Answered: 1 week ago
Question
Answered: 1 week ago
Question
Answered: 1 week ago
Question
Answered: 1 week ago
Question
Answered: 1 week ago
Question
Answered: 1 week ago
View Answer in SolutionInn App


