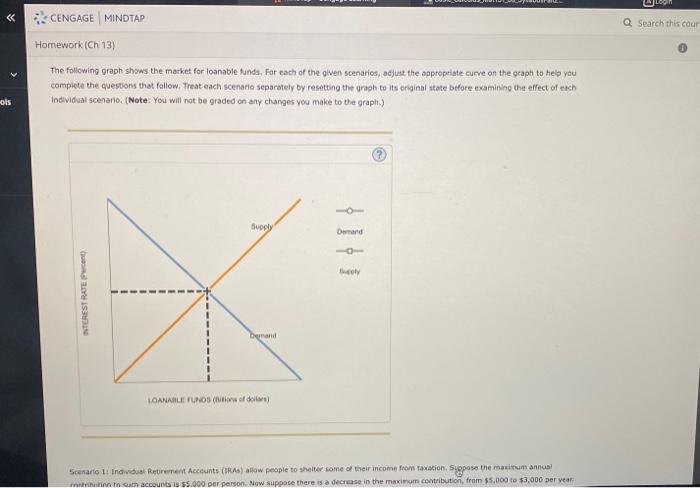
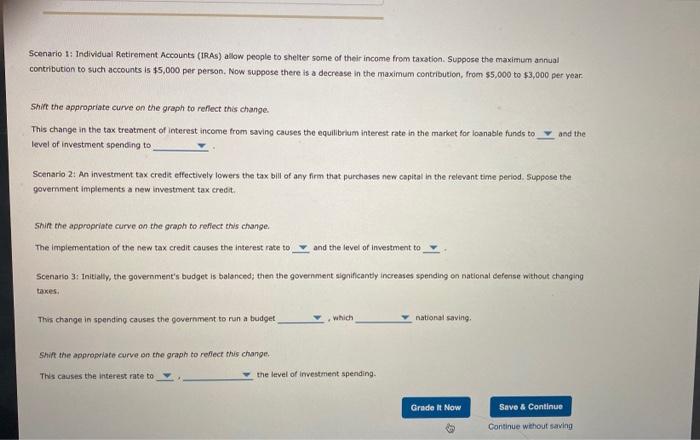
The following graph shaws the market for loanable funds, For each of the given scenarios, adjiat the opptoptiate curve on the graph to heip yau compiete the cuestons that fallow, Theat each scenario separately by resetting the graph to its original stote before examinith the effect of etch Individual scenario. (Note: You will nat be graded on any changes you make to the graph.) metnhukinin th oum accounts is 55.000 per person. Now suppose there is a decrase in the maximam cortribution, fram $5.009 to $3,000 per vear: Scenario 1: Individual Retirement Accounts (iras) asow people to shelter some of their income from taxation. Suppose the maximum arnual contribution to sucti accounts is $5,000 per person. Now suppose there is a decrease in the maximum contribution, from $5,000 to 53,000 per year. Shit the appropriate curve on the graph to reflect this change. This change in the tax treatment of interest income from saving causes the equilibrium interest rate in the market for loanable funds to and the level of investment spending to Scenario 2: An investment tax credit effectively lowers the tax bill of any firm that purchases new copital in the relevent time period. Suppose the govemment implements a new investment tax crect. Shit the appropriate curve on the graph to refiect this change. The impiementation of the new tax credit causes the interest rate to and the level of investment to Scenario 3: Initially, the government's budget is balanced; then the government slgnificanty increases spending on national cefense without changing taxes. This change in spending causes the government to run a budget , which national saving. Shirt the appropriate curve on the graph to refiect this change. Ths causes the interest nate to the level of investment spending