

Question
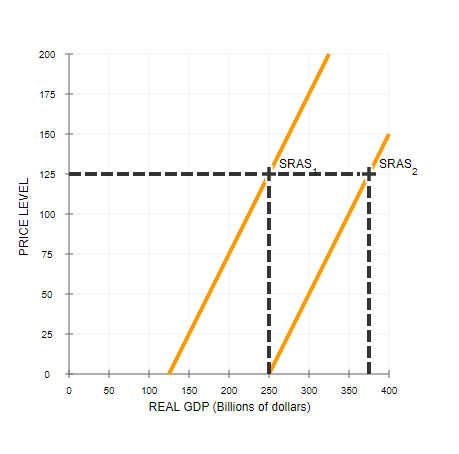
The following graph shows an increase in short-run aggregate supply (SRAS SRAS) in a hypothetical economy. Specifically, short-run aggregate supply shifts to the right from
The following graph shows an increase in short-run aggregate supply (SRAS
SRAS) in a hypothetical economy. Specifically, short-run aggregate supply shifts to the right from SRAS1toSRAS2, causing the quantity of output supplied at a price level of 125 to rise from $250 billion to $350 billion.
Step by Step Solution
There are 3 Steps involved in it
Step: 1

Get Instant Access to Expert-Tailored Solutions
See step-by-step solutions with expert insights and AI powered tools for academic success
Step: 2

Step: 3
Ace Your Homework with AI
Get the answers you need in no time with our AI-driven, step-by-step assistance
Get Started
Econometric Analysis
Authors: William H. Greene
5th Edition
130661899, 978-0130661890