Answered step by step
Verified Expert Solution
Link Copied!

Question

1 Approved Answer

The following graph shows the approximate value of the U. S. Consumer Price Index ( CPI ) from September 2004 through November 2005 . |
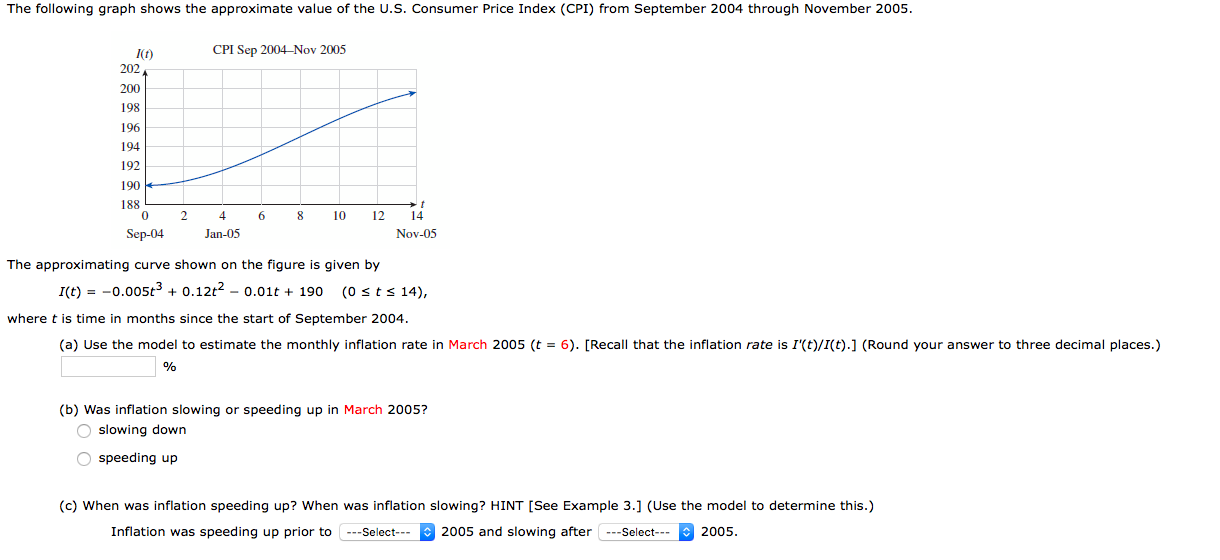
image text in transcribed
The following graph shows the approximate value of the U. S. Consumer Price Index ( CPI ) from September 2004 through November 2005 . | ( t ) [FI Sep 20.04_ Nov 201 15 202, 200 198 195 194 192 190 188 1 O 2 4 8 10 12 14 Jan - 175 Nov - 215 The approximationg curve shown on the figure is given by [ (t ) = - 0. 005+ + 0. 121 - 0. 01t + 190 ( 0 = = = 1 4 ), where I is time in months since the start of September 2004 . ( a ) Use the model to estimate the monthly inflation rate in March 2005 ( = = 6 ) . [ Recall that the inflation rate is !' (ty / I(t ) . I ( Round your answer to three decimal places . ) ( b ) Was inflation slowing or speeding up in March 2005 ?) O' slowing down O speeding Up ( C ) When was inflation speeding up ? When was inflation slowing ? HINT [SEE Example 3 . ] ( Use the model to determine this . " Inflation was speeding up prior to| _ _ _ Select _ _ _*$ 2005 and slowing after| _ _ _ Select- - -$ 2005

Step by Step Solution

There are 3 Steps involved in it

Step: 1

blur-text-image

Get Instant Access to Expert-Tailored Solutions

See step-by-step solutions with expert insights and AI powered tools for academic success

Step: 2

blur-text-image

Step: 3

blur-text-image

Ace Your Homework with AI

Get the answers you need in no time with our AI-driven, step-by-step assistance

Get Started

Recommended Textbook for

Quantitative Analysis For Management

Authors: Barry Render, Ralph M. Stair, Michael E. Hanna

11th Edition

9780132997621, 132149117, 132997622, 978-0132149112

Students also viewed these Mathematics questions