Answered step by step
Verified Expert Solution
Question
1 Approved Answer
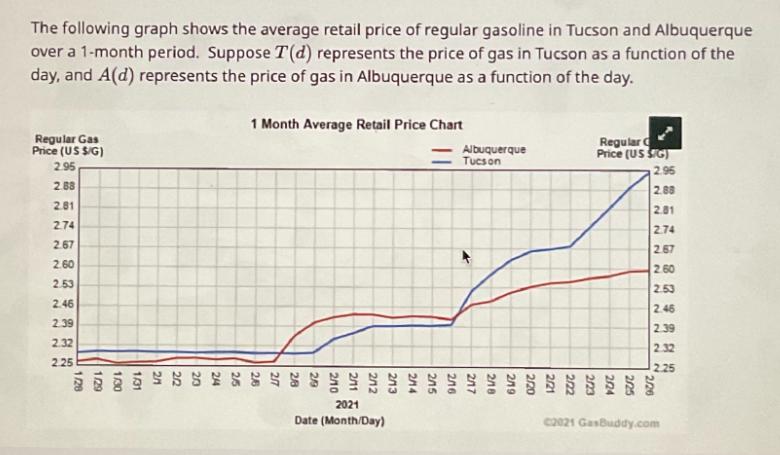
The following graph shows the average retail price of regular gasoline in Tucson and Albuquerque over a 1-month period. Suppose T(d) represents the price


The following graph shows the average retail price of regular gasoline in Tucson and Albuquerque over a 1-month period. Suppose T(d) represents the price of gas in Tucson as a function of the day, and A(d) represents the price of gas in Albuquerque as a function of the day. 1 Month Average Retail Price Chart Regular Gas Price (US$/G) 2.95 2.88 2.81 2.74 2.67 2.60 2.53 2.46 2.39 2.32 2.25 201 131 Regular C Albuquerque Tucson Price (US SIG) 2.96 2.88 2.81 2.74 2.67 2.60 2.53 2.46 2.39 2.32 2.25 2123 2/22 2/21 2/20 2/19 2/18 2/17 2/16 2015 2/14 2/13 2021 Date (Month/Day) C2021 GasBuddy.com A) Consider the function (T-A)(d). What does it mean in practical terms if (T - A) (d) is... A1) positive? A2) negative? A3) zero? B) Using the graphs, determine the following: B1) On what day(s) does (TA)(d) = 0 B2) What is the lowest/most negative value of (TA)(d)? On what date does that occur? B3) What is the largest/most positive value of (TA)(d)? On what date does that occur?
Step by Step Solution
There are 3 Steps involved in it
Step: 1

Get Instant Access to Expert-Tailored Solutions
See step-by-step solutions with expert insights and AI powered tools for academic success
Step: 2

Step: 3

Ace Your Homework with AI
Get the answers you need in no time with our AI-driven, step-by-step assistance
Get Started


