

Answered step by step
Verified Expert Solution
Question
1 Approved Answer
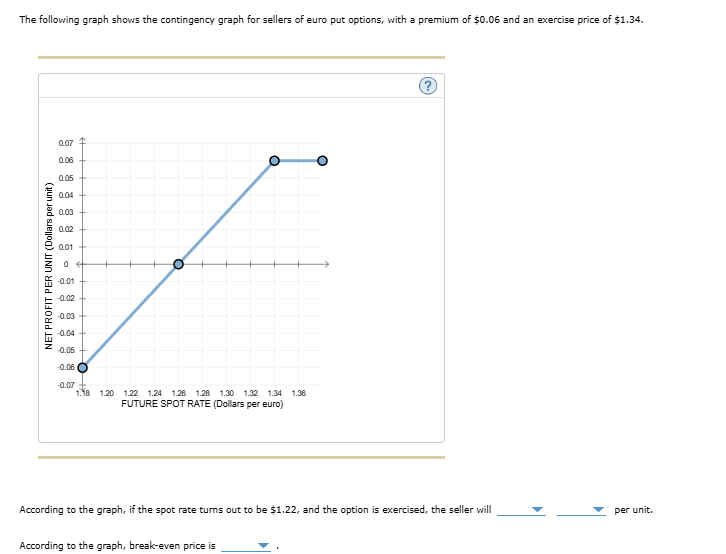
The following graph shows the contingency graph for sellers of euro put options, with a premium of $ 0 . 0 6 and an exercise
The following graph shows the contingency graph for sellers of euro put options, with a premium of $ and an exercise price of $
According to the graph, if the spot rate turns out to be $ and the option is exercised, the seller will
According to the graph, breakeven price is
Step by Step Solution
There are 3 Steps involved in it
Step: 1

Get Instant Access to Expert-Tailored Solutions
See step-by-step solutions with expert insights and AI powered tools for academic success
Step: 2

Step: 3
Ace Your Homework with AI
Get the answers you need in no time with our AI-driven, step-by-step assistance
Get Started
Trading From Your Gut How To Use Right Brain Instinct And Left Brain Smarts To Become A Master Trader
Authors: Curtis Faith
1st Edition
0137047681,0137051689