Question
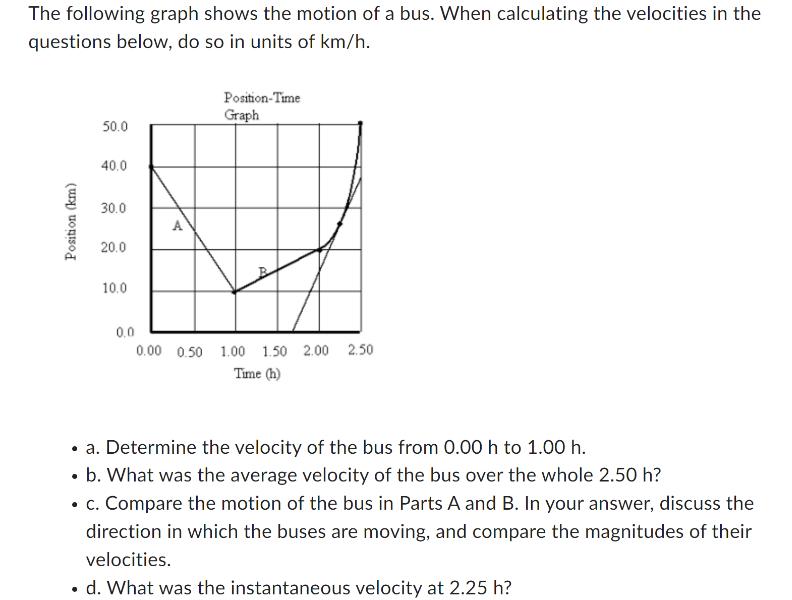
The following graph shows the motion of a bus. When calculating the velocities in the questions below, do so in units of km/h. Position

The following graph shows the motion of a bus. When calculating the velocities in the questions below, do so in units of km/h. Position (km) 50.0 40.0 30.0 20.0 10.0 A Position-Time Graph 0.0 0.00 0.50 1.00 1.50 2.00 2.50 Time (h) a. Determine the velocity of the bus from 0.00 h to 1.00 h. b. What was the average velocity of the bus over the whole 2.50 h? c. Compare the motion of the bus in Parts A and B. In your answer, discuss the direction in which the buses are moving, and compare the magnitudes of their velocities. . d. What was the instantaneous velocity at 2.25 h?
Step by Step Solution
There are 3 Steps involved in it
Step: 1

Get Instant Access to Expert-Tailored Solutions
See step-by-step solutions with expert insights and AI powered tools for academic success
Step: 2

Step: 3

Ace Your Homework with AI
Get the answers you need in no time with our AI-driven, step-by-step assistance
Get StartedRecommended Textbook for
Core Macroeconomics
Authors: Eric Chiang
3rd edition
978-1429278478, 1429278471, 978-1429278492, 1429278498, 1464191433, 978-1464191435
Students also viewed these Physics questions
Question
Answered: 1 week ago
Question
Answered: 1 week ago
Question
Answered: 1 week ago
Question
Answered: 1 week ago
Question
Answered: 1 week ago
Question
Answered: 1 week ago
Question
Answered: 1 week ago
Question
Answered: 1 week ago
Question
Answered: 1 week ago
Question
Answered: 1 week ago
Question
Answered: 1 week ago
Question
Answered: 1 week ago
Question
Answered: 1 week ago
Question
Answered: 1 week ago
Question
Answered: 1 week ago
Question
Answered: 1 week ago
Question
Answered: 1 week ago
Question
Answered: 1 week ago
Question
Answered: 1 week ago
Question
Answered: 1 week ago
Question
Answered: 1 week ago
Question
Answered: 1 week ago
View Answer in SolutionInn App


