

Question
The following graph shows the number of muffins sold at a store during a given week Muffins sold 16 129 14 10 6420 8 Monday

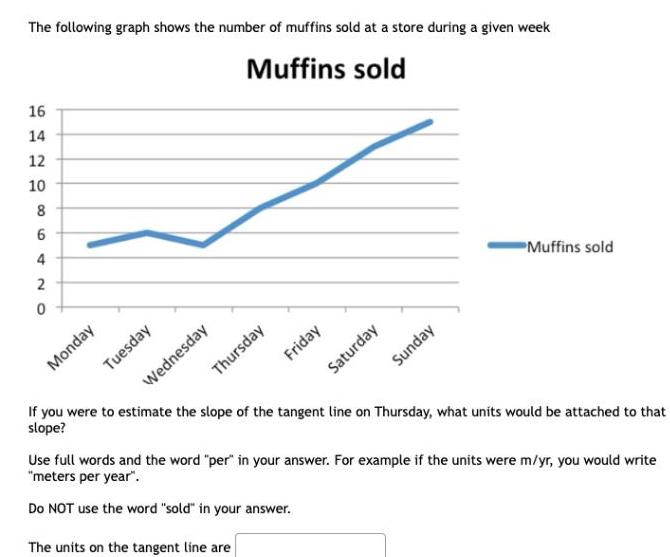
The following graph shows the number of muffins sold at a store during a given week Muffins sold 16 129 14 10 6420 8 Monday Tuesday Thursday Wednesday Friday Sunday Saturday Muffins sold If you were to estimate the slope of the tangent line on Thursday what units would be attached to that slope Use full words and the word per in your answer For example if the units were m yr you would write meters per year Do NOT use the word sold in your answer The units on the tangent line are
Step by Step Solution
There are 3 Steps involved in it
Step: 1

Get Instant Access to Expert-Tailored Solutions
See step-by-step solutions with expert insights and AI powered tools for academic success
Step: 2

Step: 3
Ace Your Homework with AI
Get the answers you need in no time with our AI-driven, step-by-step assistance
Get Started
Finite Mathematics An Applied Approach
Authors: Michael Sullivan
11th Edition
1118050258, 9781118050255