

Answered step by step
Verified Expert Solution
Question
1 Approved Answer
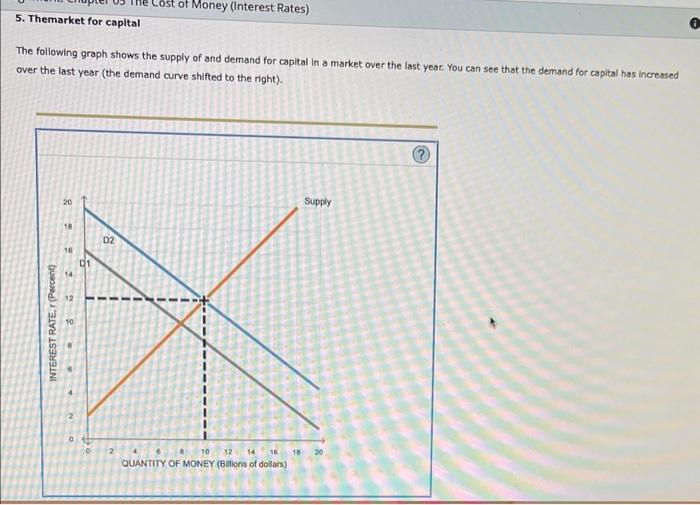
The following graph shows the supply of and demand for capltal in a market over the last yeac. You can see that the demand for
Step by Step Solution
There are 3 Steps involved in it
Step: 1

Get Instant Access to Expert-Tailored Solutions
See step-by-step solutions with expert insights and AI powered tools for academic success
Step: 2

Step: 3
Ace Your Homework with AI
Get the answers you need in no time with our AI-driven, step-by-step assistance
Get Started
Cases In Healthcare Finance
Authors: Louis C. Gapenski
3rd Edition
1567932444, 9781567932447