Answered step by step
Verified Expert Solution
Question
1 Approved Answer
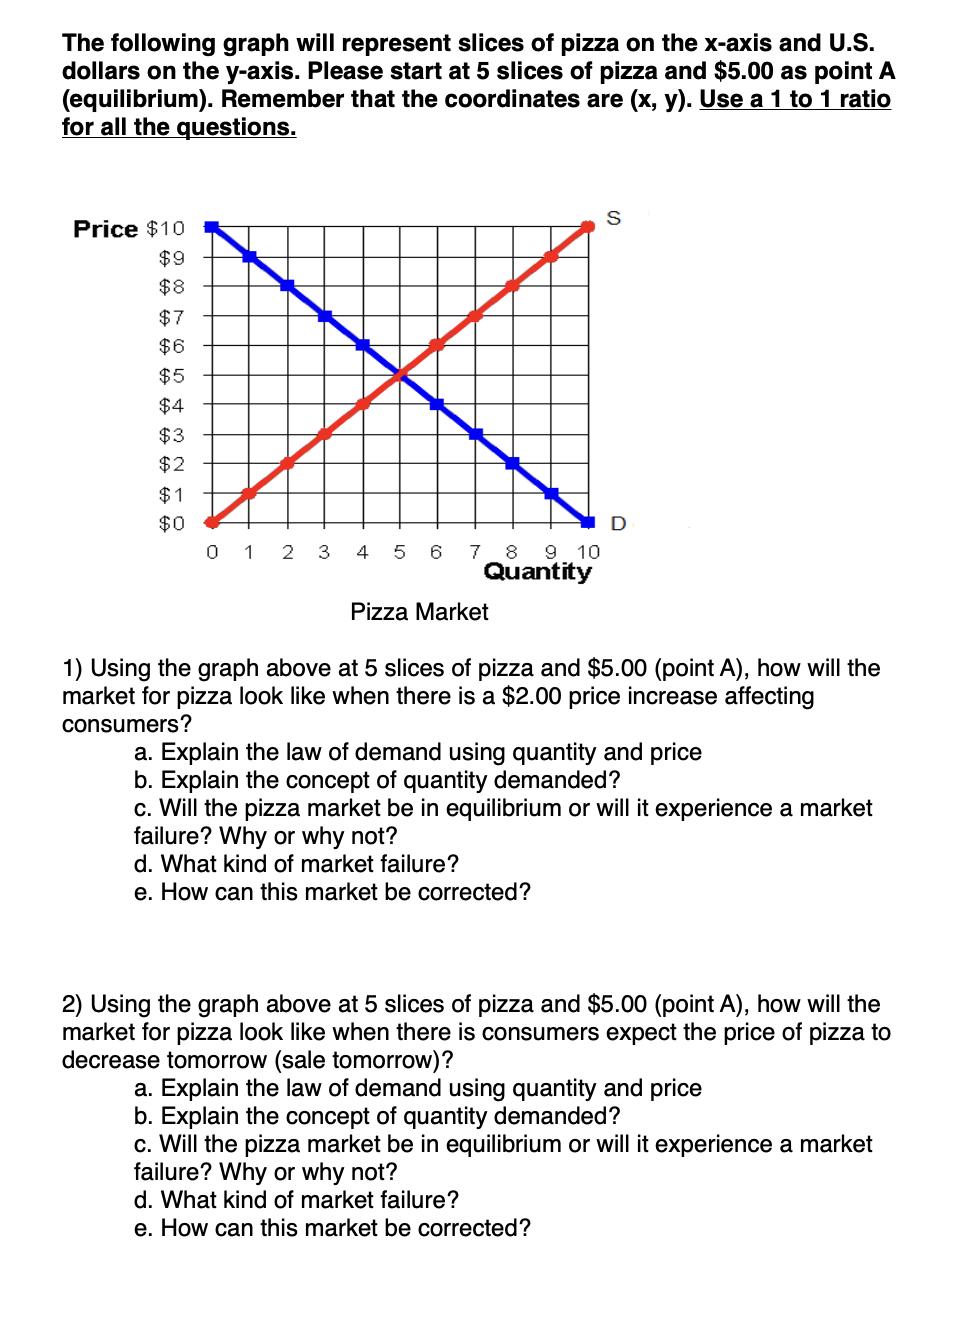
The following graph will represent slices of pizza on the x-axis and U.S. dollars on the y-axis. Please start at 5 slices of pizza

The following graph will represent slices of pizza on the x-axis and U.S. dollars on the y-axis. Please start at 5 slices of pizza and $5.00 as point A (equilibrium). Remember that the coordinates are (x, y). Use a 1 to 1 ratio for all the questions. Price $10 $9 $8 $7 $6 $5 $4 $3 $2 $1 $0 0 1 2 3 4 5 6 7 8 9 10 Quantity Pizza Market S 1) Using the graph above at 5 slices of pizza and $5.00 (point A), how will the market for pizza look like when there is a $2.00 price increase affecting consumers? a. Explain the law of demand using quantity and price b. Explain the concept of quantity demanded? c. Will the pizza market be in equilibrium or will it experience a market failure? Why or why not? d. What kind of market failure? e. How can this market be corrected? 2) Using the graph above at 5 slices of pizza and $5.00 (point A), how will the market for pizza look like when there is consumers expect the price of pizza to decrease tomorrow (sale tomorrow)? a. Explain the law of demand using quantity and price b. Explain the concept of quantity demanded? c. Will the pizza market be in equilibrium or will it experience a market failure? Why or why not? d. What kind of market failure? e. How can this market be corrected?
Step by Step Solution
★★★★★
3.33 Rating (165 Votes )
There are 3 Steps involved in it
Step: 1

Get Instant Access to Expert-Tailored Solutions
See step-by-step solutions with expert insights and AI powered tools for academic success
Step: 2

Step: 3

Ace Your Homework with AI
Get the answers you need in no time with our AI-driven, step-by-step assistance
Get Started


