

Answered step by step
Verified Expert Solution
Question
1 Approved Answer
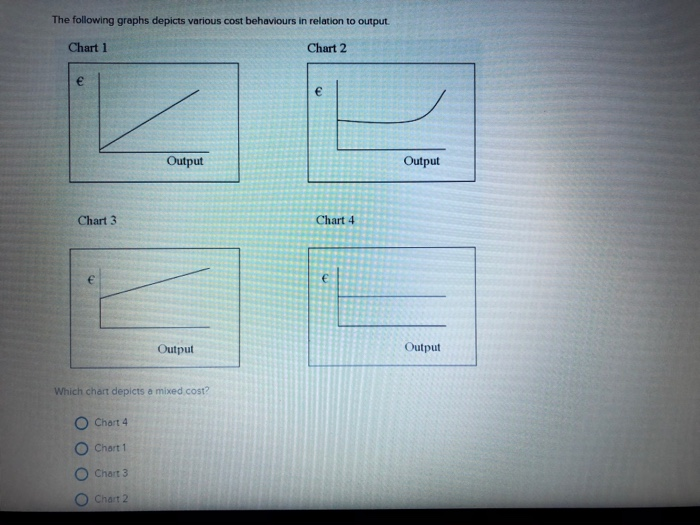
The following graphs depicts various cost behaviours in relation to output Chart 1 Chart 2 Output Output Chart 3 Chart 4 Output Output Which chart
Step by Step Solution
There are 3 Steps involved in it
Step: 1

Get Instant Access to Expert-Tailored Solutions
See step-by-step solutions with expert insights and AI powered tools for academic success
Step: 2

Step: 3
Ace Your Homework with AI
Get the answers you need in no time with our AI-driven, step-by-step assistance
Get Started
Custom Edition For University Of Central Florida From Managerial Accounting
Authors: Karen Wilken Braun, Wendy Tietz
3rd Edition
1269451839, 978-1269451833