

Question
The following graphs illustrate the jewellery market as a perfectly competitive market. The left-hand figure shows the market demand and supply curves; the right-hand figure
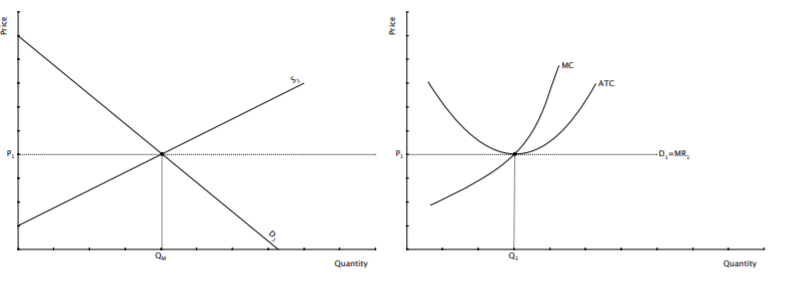
The following graphs illustrate the jewellery market as a perfectly competitive market. The left-hand figure shows the market demand and supply curves; the right-hand figure shows a representative firm. Assume the market is in the long-run equilibrium.
(a) Demand for jewellery is given by D1 = 216?24P and the supply function is S1 = ?40 + 40P. Compute the market equilibrium price and quantity. (b) Suppose each firm's average total cost is given by AT C = 1 + 1.5Qfirm, where Qfirm is the quantity produced by an individual firm.1 What is the quantity Qfirm produced by each firm in the long-run equilibrium? (c) How many firms operate in this market in the long-run equilibrium? (d) Assume the economy slows down, leading to a permanent drop in the demand for jewellery. Discuss how this change in demand affects the jewellery market in the short and long-run. In particular, you should discuss how, in the short and long-run, the drop in demand affects prices, profits, production quantities, and the number of firms. You may use graphs similar to the ones provided above to support your answer. e) Computer-aided design has made jewellery production significantly faster/less expensive. Discuss how the decrease in production costs, i.e., in average total cost and marginal cost, should affect the jewellery market in the short and long-run.
Step by Step Solution
There are 3 Steps involved in it
Step: 1

Get Instant Access to Expert-Tailored Solutions
See step-by-step solutions with expert insights and AI powered tools for academic success
Step: 2

Step: 3
Ace Your Homework with AI
Get the answers you need in no time with our AI-driven, step-by-step assistance
Get Started
Macroeconomics Principles And Policy
Authors: William J. Baumol, Alan S. Blinder
11th Edition
0324586213, 978-0324586213