

Answered step by step
Verified Expert Solution
Question
1 Approved Answer
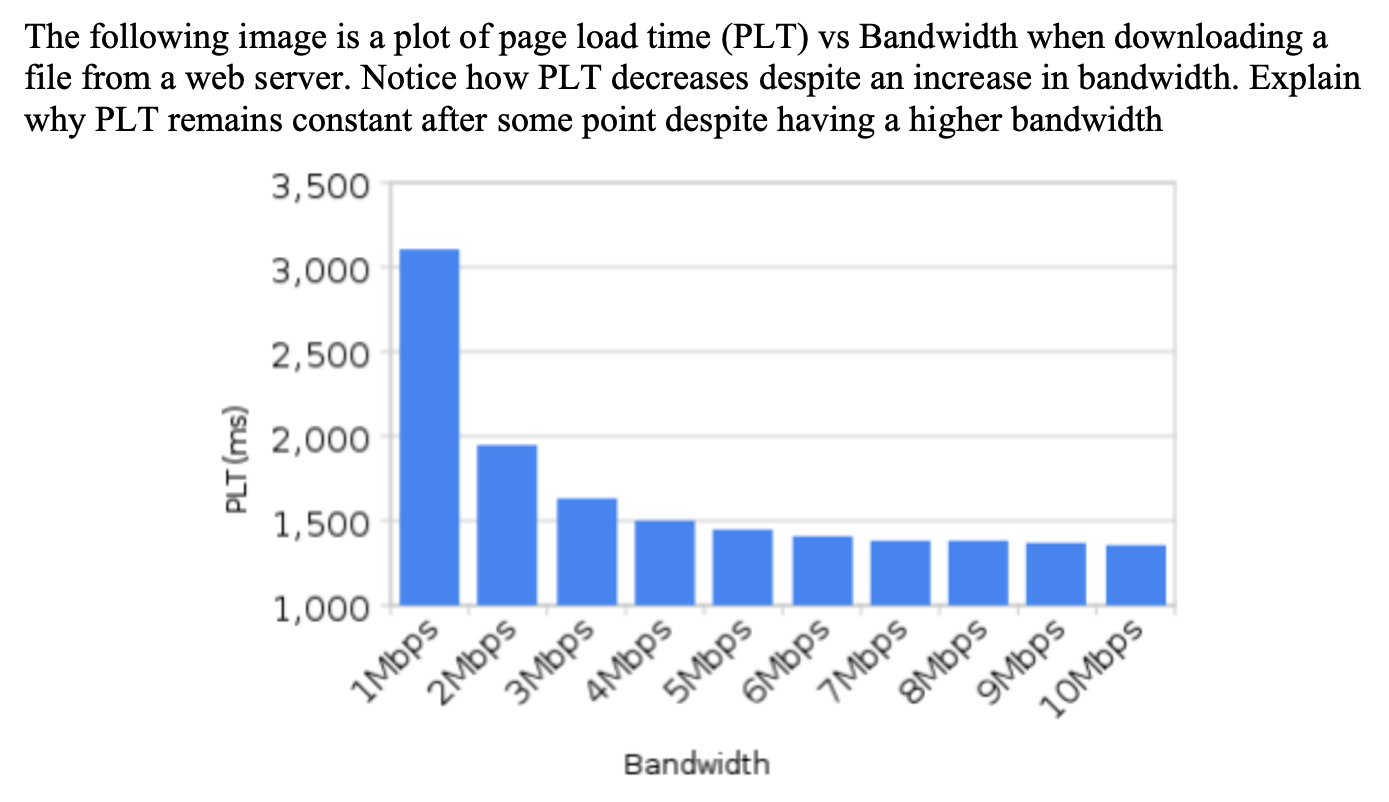
The following image is a plot of page load time (PLT) vs Bandwidth when downloading a file from a web server. Notice how PLT decreases
Step by Step Solution
There are 3 Steps involved in it
Step: 1

Get Instant Access to Expert-Tailored Solutions
See step-by-step solutions with expert insights and AI powered tools for academic success
Step: 2

Step: 3
Ace Your Homework with AI
Get the answers you need in no time with our AI-driven, step-by-step assistance
Get Started
Beginning Database Design Solutions Understanding And Implementing Database Design Concepts For The Cloud And Beyond
Authors: Rod Stephens
2nd Edition
1394155727, 978-1394155729